While the Fed Fiddles, the Dollar Burns: Dollar’s Purchasing Power Plunged at Fastest Pace since 1982
Defying economists’ expectations for sixth month in a row, inflation heats up instead of easing off. And it’s a lot worse than it seems.
The Consumer Price Index jumped 0.9% in June from May, after having jumped 0.6% in May, and 0.8% in April – all of them the steepest month-to-month jumps since 2009, according to the Bureau of Labor Statistics today. The CPI without the volatile food and energy components (“core CPI”) jumped by 0.8% for the month and by 9.5% for the past three months annualized, the red-hottest “core CPI” since June 1982.
The CPI tracks the loss of the purchasing power of the consumer dollar – everything denominated in dollars for consumers, including what they can buy with their labor – and this dollar has dropped at a rate of 10.7% over the past three months annualized, the fastest drop since June 1982
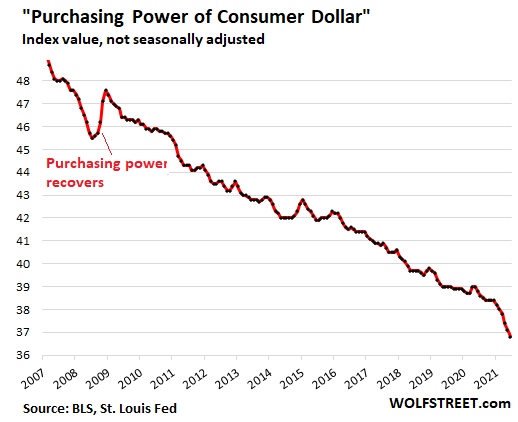
Loss of purchasing power is “permanent,” as the chart shows.
There is nothing “transitory” or “temporary” about the loss of purchasing power as the chart above shows. Only a period of deflation can reverse some of the drop in purchasing power, which is a rare event in the US and happened only a few quarters over my lifetime, including for several months in 2008 – that little notch in the chart above.
The only aspect of inflation or the loss of purchasing power of the dollar that is temporary is the speed with which it progresses, faster or slower, from month to month.
Actual home price spikes v. charade of CPI for housing.
Housing costs – rent and homeownership costs – are included in the CPI as services and account for about one-third of the overall CPI. It’s the biggie, but it barely moves despite surging housing costs.
The rent component of CPI (“rent of primary residence”), weighing 7.7% in the overall CPI has been ticking up every month this year at a constant 0.2%, including in June, and is up only 1.9% year-over-year.
The homeownership component (“Owners’ equivalent rent of residences”), weighing 23.7% in the overall CPI, rose 0.5% in June and only a stunningly low 2.3% year-over-year, even as home prices have exploded, no matter how they’re measured.
The median price of all types of existing homes in the US, as tracked by the National Association of Realtors, spiked by a record 24% compared to a year ago.
The Case-Shiller Home Price Index, which measures the price changes over time for the same house and is, therefore, an appropriate measure of house price inflation, spiked by 14.6% year-over-year, the red-hottest increase in the data going back to 1987 (purple line). This contrasts with the languid CPI for homeownership (red line):
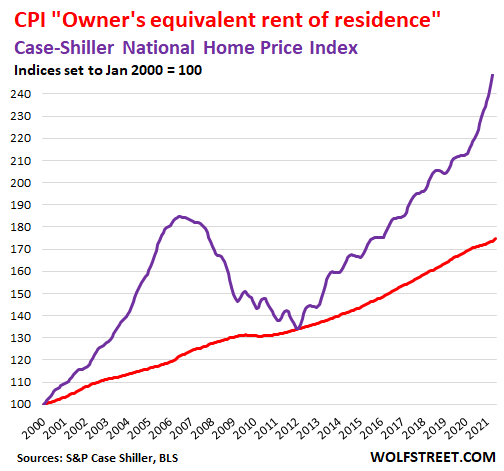
The reason the CPI’s homeownership component doesn’t track this rampant home-price inflation, and thereby the loss of the dollar’s purchasing power with regards to homes, is because it doesn’t track it. It is survey-based, and tracks what homeowners think their home might rent for – hence its name, “owners’ equivalent rent of residences.” It is a measure of rent, as imagined by the homeowner…..
*****
Continue reading this article published July 13, 2021 at Wolf Street.