Dollar’s Purchasing Power Plunged at Constant Speed
Now it’s new vehicles, restaurants, energy. Game of Whac-A-Mole as some price spikes slow while others begin. But it’s a lot worse than it seems.
The Consumer Price Index (CPI) jumped 0.5% in July from June, after having jumped 0.9% in June, 0.6% in May, for a three-month annualized rate – the three-month momentum – of 8.1%. Year-over-year, CPI jumped 5.4%, same pace as in June, and the fastest since June 2008 (5.6%), all of which had been the fastest since January 1991, according to data released by the Bureau of Labor Statistics today.
The CPI without the volatile food and energy components (“core CPI”) rose by 0.3% for the month and by 4.3% year-over-year.
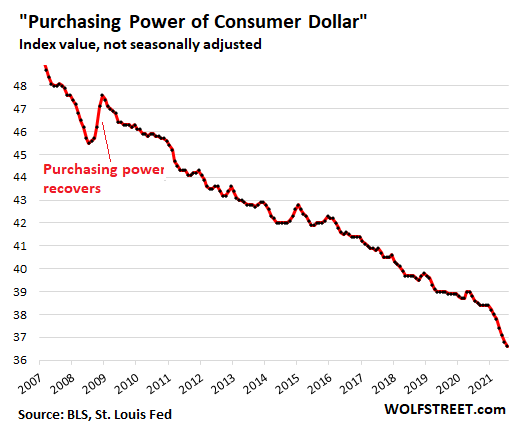
The CPI measures the loss of the purchasing power – well, part of the loss of the purchasing power, as we’ll see in a moment – of the consumer dollar and thereby the purchasing power of labor. In July, this purchasing power dropped another 0.5% for the month, and for the past three months annualized, it dropped by 8.6% – “Honey, where did my big raise go?”
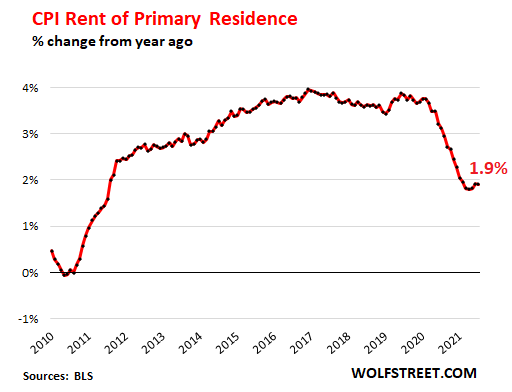
Homeownership costs and rents account for 31% of CPI. These are the largest categories, the most important categories, but they hardly budged despite exploding housing costs and thereby suppressed the CPI.
“Rent of primary residence,” which weighs 7.6% in the overall CPI, ticked up just 1.9% year-over-year despite the chaos going on in the rental market, as many cities experienced double-digit rent increases, while others experienced declines. Every month this year, it nudged up 0.2% from the prior month as if nothing had happened. This is the CPI for rent, which has dropped from the 4% range in 2019 to 1.9%:
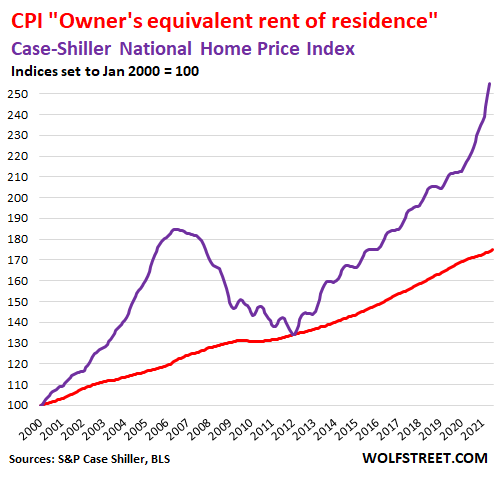
“Owners’ equivalent rent of residences” – the component that tracks the costs of homeownership and weighs 23.6% in the overall CPI – rose just 2.4% year-over-year despite the historic price explosion in the housing market.
The CPI’s homeownership component doesn’t track actual home-price inflation, but it is based on surveys that ask what homeowners think their home might rent for and is therefore a measure of rent as seen by the homeowner.
Meanwhile, back at the ranch, the national median price of existing homes spiked by 23.4% year-over-year, according to the National Association of Realtors.
The Case-Shiller Home Price Index, which tracks the price changes of the same house and is, therefore, a measure of house price inflation, spiked by 16.6% year-over year, the most in the data going back to 1987 (purple line). And yet, the measure for the costs of homeownership by the BLS barely budged (red line):
Energy costs spiked 23.8% year-over-year.
Energy accounts for 7.2% of the overall CPI. The spike was driven by gasoline, a surprise to no one who has filled up a tank of gas recently, which jumped 41.8% year-over-year. Natural gas jumped 19% year-over-year. The CPI for electricity service to the home rose 4.0% year-over-year…..
*****