Curse of Easy Money: US Government Interest Payments v. Tax Receipts, Average Interest on Treasury Debt, & Debt to GDP
By Wolf Richter
Spiking Interest payments will hopefully, knock on wood, force the drunken sailors in Washington to go through detox.
The gigantic US government debt is now approaching $33 trillion, amid a tsunami of issuance of Treasury securities to fund the mind-blowing government deficits and roll over maturing securities. At the same time, the Fed has hiked its policy rates where borrowing with short-term Treasury bills costs the government now close to 5.5% in interest, and borrowing longer-term costs over 4%.
But, the higher interest rates that the government pays now apply only to the new Treasury securities to fund the new deficits and to replace maturing securities with lower rates. The securities issued years ago will cost the government whatever coupon interest they came with until they mature.
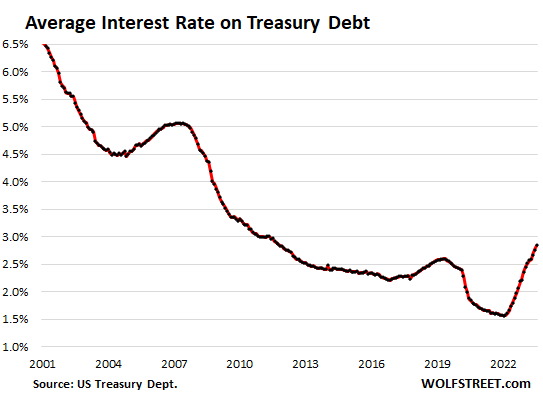
So the average interest rate that the government is paying on all its interest-bearing debt has been ticking up gradually from the historic low point of 1.57% in February 2022 to 2.84% in July. And it will continue to rise as new securities with higher interest rates take on a larger share. Back in 2001, the average interest rate was over 6%:
To what extent do interest payments eat up tax revenues?
So first the primary measure of the burden of the national debt on government finances, and then into the components: The chart below shows interest expense as a percent of tax revenues. This measure of tax revenues – total tax revenues minus contributions to social insurance and some other factors – was released today by the Bureau of Economic Analysis as part of its GDP revision. This is what’s available to pay for regular government expenditures, including interest expense.
The ratio of interest expense as a percent of tax revenues spiked to 36.2% in Q2, up from 33.0% in Q1, and up from 20.9% a year ago, a huge jump in just one year.
- The ratio (36.2%) is back where it had been in Q1 1997
- In Q1 2022, the ratio had dropped to 19.3%, lowest since 1969.
- Between 1983 and 1993, the ratio ranged from 45% to 52%. Oh, those crazy times! Eventually, it triggered a lot of fretting, including in Congress.
Detox not yet. As we saw back when interest expense ate nearly half of the federal tax revenues in the 1980s through the early 1990s, a high-interest burden might be the only discipline available that will sober up our drunken sailors in Congress. But I’m not taking any bets on it. Drunken sailors don’t want to sober up. Free booze for this long is a terrible thing. Hard to detox…..
*****
Continue reading this article at Wolf Street.
TAKE ACTION
As we move through 2023 and into the next election cycle, The Prickly Pear will resume Take Action recommendations and information.
This article is courtesy of ThePricklyPear.org, an online voice for citizen journalists to express the principles of limited government and personal liberty to the public, to policy makers, and to political activists. Please visit ThePricklyPear.org for more great content.