Don’t Let the Headlines Fool You about a Tiny Month-to-Month Uptick in Pending Home Sales
By Wolf Richter
Still -21% from a Year Ago, -25% from 2 & 3 Years Ago. Have a Look at the Chart.
Spring selling season volume lowest since Housing Bust 1.
So you read in the headlines today that pending home sales rose “unexpectedly” for the third month in a row, and that’s another sign that the boom in the housing market is back, LOL. So let’s bring a dose of reality to these headlines.
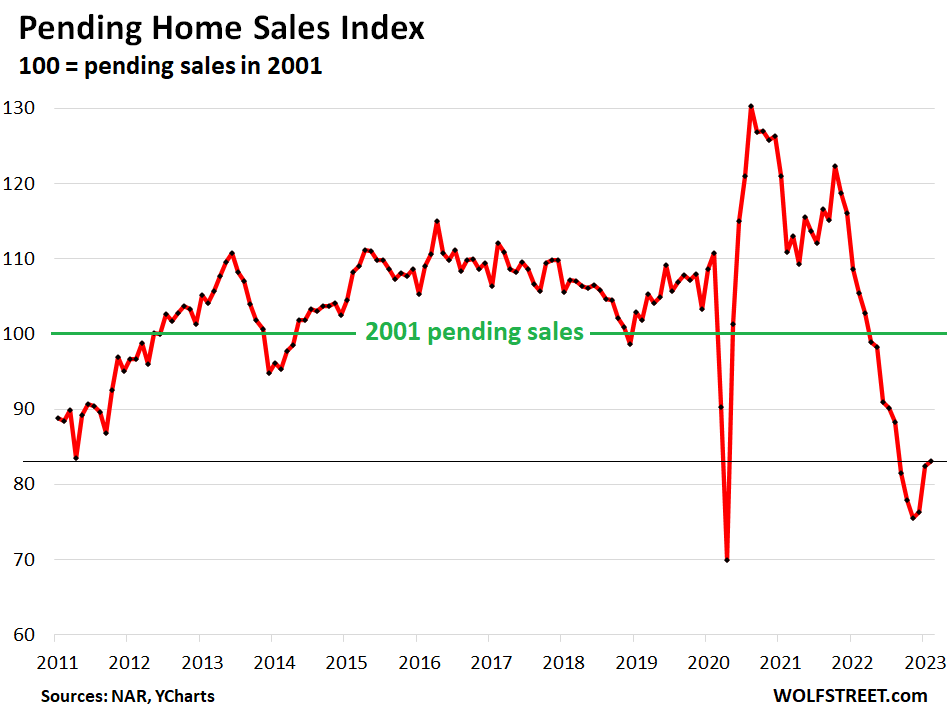
The National Association of Realtors reported today that “pending sales” – “a forward-looking indicator of home sales based on contract signings” – ticked up 0.8% in February from January to an index value of 83.2.
So wait… The index value was set at 100 for contract signings in 2001. So today’s value of 83.2 is down 16.9% from the index average in 2001. And wait… Compared to the prior three Februarys, the index value of contract signings plunged…
- By 21% from February 2022
- By 25% from February 2021
- By 25% from February 2020.
The chart above (data via YCharts) shows how tiny the uptick was in February from January, and how huge the plunge was from the prior periods.
Outside of the lockdown April 2020, when the brokerage industry essentially shut down, pending home sales since last August have been at the lowest levels in many years.
Pending home sales by region, compared to February a year ago (map via NAR):
The NAR defines a “pending sale” as a transaction where the contract was signed but has not yet closed. At this point, the deal can still fall through for a variety of reasons. If all goes well, the sale usually closes “within one or two months of signing,” the NAR says…..
*****
Continue reading this article at Wolf Street.
TAKE ACTION
As we move through 2023 and into the next election cycle, The Prickly Pear will resume Take Action recommendations and information.
This article is courtesy of ThePricklyPear.org, an online voice for citizen journalists to express the principles of limited government and personal liberty to the public, to policy makers, and to political activists. Please visit ThePricklyPear.org for more great content.