Stocks Suffer For The Last Two Months And More Likely Ahead
By Neland Nobel
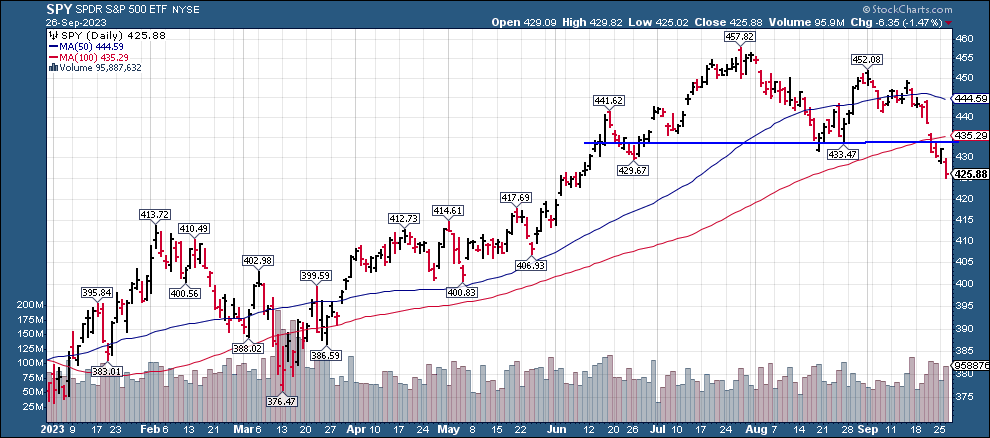
Readers might recall on August 3, and subsequent to that, we suggested that the stock market had gotten “overbought” and was vulnerable to the weakness that typically is found (called seasonality) in the late summer.
Whether we are just lucky or smart, the market has cooperated by declining about 7% since our word of caution, about the same as the February-March correction. It is doing some damage. Recently the S&P dropped below a triple bottom in the range of 430 and the daily price has fallen below both the 50-day moving average and the 100-day moving average. A bull trend line formed from the lows of last October has been broken. The overall formation takes the familiar head and shoulders top with the “neckline” being snapped. For those who think charts can inform us about markets, none of this is good right now.
September is usually the worst month but October takes the prize for the month with the most crashes. Then the market will tend to bottom out and usually has a strong finish to the year and that bleeds usually into January.
These seasonal factors and chart factors aside, we also mentioned a number of other negatives the market must work with right now.
Breadth has been unusually narrow, with only a handful of stocks (the magnificent seven) providing the upside for the S&P, which is supposed to be a broadly diversified portfolio of 500 stocks. Instead, it has become an extremely undiversified tech-dominated index. Historically, that is not good. Narrow breadth indicates strength is just with a small group of stocks, not the market as a whole. Secondly, as we pointed out, this destroys much of the justification for indexing, which in the past has been a good strategy for the average investor.
Interest rates continue to rise. The most recent FED meeting indicated they are looking for interest rates to go higher, for a longer period of time than many participants anticipated. Adding additional pain, since the most recent “debt ceiling agreement”, the government has been adding debt at a ferocious pace. This means more bonds must be sold. With traditional buyers like Social Security (cash flow has turned negative), China, Saudi Arabia, and others reducing their purchases of US debt, and the FED itself selling; more supply with less demand means lower bond prices. Not surprisingly, this year is likely to be the third year in a row for negative returns on bonds.
Two rating services have downgraded the sovereign debt of the US. Unfortunately, another debt ceiling fight looms. Understand, this fight may well be worth having. Nothing in the traditional political toolbox seems able to stop the two political parties from spending this nation into penury. As the chart below suggests, we are growing national debt more than twice the rate of GDP growth. How about some sustainability talk about this relationship? However, attempts to stop spending by shutting down the government are a crude tool, likely to upset the bond and stock markets even further.
Higher interest rates are squeezing the marginal debtor as we suggested it would. Corporate bankruptcy rates are rising sharply. Commercial real estate is being hurt, as is the market for homes generally and the combination of high home prices and much higher rates have driven affordability to new lows. The turnover in homes has slowed to a crawl and homebuyers who were fortunate enough to get 3% mortgage rates seemed disinclined to move, create a capital gain, and then get saddled with rates now above 7.5%. It makes sense to stay put, but that freezes the supply of secondary homes and reduces liquidity in the whole sector.
The rise in interest rates has been international as well, creating major credit problems elsewhere. Germany is in a bona fide recession (the largest economy in Europe) and China is slowing and seems in another phase of its rolling real estate crisis.
Rising rates have caused a sharp rise in the dollar, depressing commodity prices (except for oil and uranium) and making the US exports uncompetitive in many areas.
The Administration has vowed to destroy fossil fuels without supplying the alternatives at the same or lesser price. While that plays well with environmental hysterics, the reality is after more than $4 trillion in often forced investment into “renewables”, the portion of the energy pie supplied by fossil fuels has only fallen only about 3%. We need more traditional energy while the Biden Administration has caused investment to dry up. Who wants to invest say in an offshore drilling ship, that has maybe a 30-year life, only to know the government wants you out of business in five years? It is an investment equation that can’t and won’t attract capital.
The result is much higher energy prices in the present and much more to come in the future. Just since May of this year, West Texas Intermediate oil has moved from around $64 per barrel to above $92. That is a move of about 43% in just six months! Physical stores of oil in the Strategic Petroleum Reserve are down drastically due to Biden policies and private storage at Cushing Oklahoma, and in the OECD, are down sharply as well. Biden has abandoned US energy independence and opted for yielding control of the market to Putin and the ever-treacherous Saudis.
The Leading Economic Indicators have been down a record 17 months, the money supply is contracting, and the yield curve is still inverted. The FED says now that recession is unlikely, which given their track record (remember transitory inflation?), is actually a bad thing. We wish they were worried more about the recession than they appear to be.
This set of politically mandated circumstances puts a severe squeeze on the consumer. Rising interest rates cause mortgage rates to rise and the cost of using credit cards. Rising oil prices take more money out of the family budget for fuel for both home heating and cooling, and personal transportation, transportation costs for everything else in the economy, and finally the higher costs on about 6,000 items made out of petroleum.
Don’t blame this on the bossa nova, but blame it on Bidenonomics.
So far the correction since the first of August is about 6% or so, depending on the index you are following. We would note, however, that the equal weight S&P (the RSP), is now negative on the year. With bonds down hard, we have another year where the traditional 60% equity and 40% bond diversification simply can’t work as it has in the past.
As the market has absorbed the reality of this bad news, bullish attitudes are shifting more negatively, which ironically, is a good thing.
Back in early August when we were warning about the vulnerability of the market, sentiment was very high, excessively high. Although there are many measures of sentiment, one of the better indices is the CNN Fear and Greed gauge. It hit a reading of 84 (usually anything over 80 is a caution light). As we go to press, the index has now fallen into the fear range with a reading of just 27%. It may well go lower in the next few weeks. Generally, anything below 25% is “extreme fear”.
So here is the rub. The news is getting bad out there. However, it is getting worked into market prices and taking some of the excess valuation and sentiment out of the market. But experience suggests that news must be bad for weeks, for prices to fully align with reality, and then there is customarily an overshoot into extreme pessimism, which will be just as irrational as the extreme optimism was back around the first of August.
We are not at that stage, which suggests several more weeks are likely necessary to get the market into an oversold condition. And we have to deal with October, a month that has played host to a large number of stock crashes.
Timing events such as these are almost impossible. However, the condition of the market can be known, even if the timing cannot. The current condition suggests more weakness in both stocks and bonds in the weeks ahead, likely followed by a decent buying opportunity to play the normal strength displayed at the end of the year.
So far this continues to look like a correction within the context of an ongoing bull market. The risk will be that this too will shift. If we decline enough to break the bull trend, then we enter bear territory. Bears are dangerous, and markets tend to act differently in bear markets than in bull markets. Oversold readings in bull markets provide buying opportunities (buy the dip). But bear markets are harder to handle because one low is followed by a set of new lows.
We still suggest caution, with higher cash reserves than normal and lower allocation to risk assets than you normally might have, given your age and risk profile. If we can avoid breaking the back of the market during this corrective phase, a decent buy opportunity may emerge in a few weeks.
We will do our best to keep you up to date.
****
Stock graphics courtesy of stockcharts.com and drawn by the author.
TAKE ACTION
As we move through 2023 and into the next election cycle, The Prickly Pear will resume Take Action recommendations and information.
This article is courtesy of ThePricklyPear.org, an online voice for citizen journalists to express the principles of limited government and personal liberty to the public, to policy makers, and to political activists. Please visit ThePricklyPear.org for more great content.