The Most Splendid Housing Bubbles in America, April Update: Year-over-Year Price Drops Worsen in San Francisco, Seattle, San Diego, Portland, Las Vegas, Phoenix, Los Angeles, Denver
By Wolf Richter
Even Miami lost ground. The spring selling season is a dud so far. And the banking crisis hasn’t even made it into the data yet. That’s still to come.
The spring selling season is here, but so far, it’s a dud. In some markets, home prices fell from the prior month, despite spring selling season: Miami, Seattle, Las Vegas, Portland, New York City, and Dallas, for example.
In other markets, prices ticked up from the prior month, but a lot less than a year ago, and so year-over-year, even in those markets, home prices either fell further, or the year-over-year gain was further reduced. This is based on today’s release of the S&P CoreLogic Case-Shiller Home Price Index today.
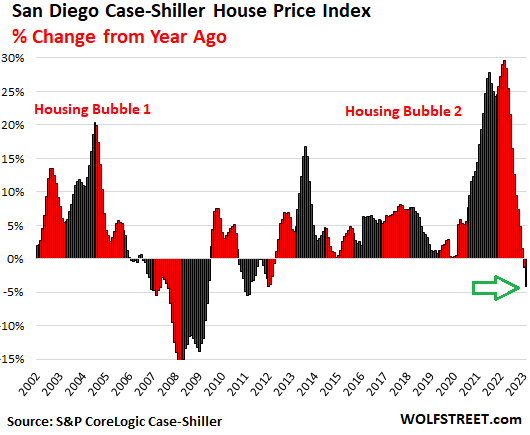
For example, in the San Diego metro, house prices rose 1.5% from the prior month, but because that increase was a lot less than the increase in the same month last year, the year-over-year decline worsened to -4.1%, from -1.3% last month. San Diego’s year-over-year percentage change illustrates the principle of how the housing market is still worsening even with a seasonal uptick because that uptick was less than in the same period a year ago:
The effects of the banking crisis are not yet reflected in the housing market data. These home prices today are based on sales that closed in February and prior months, so the March fireworks at Silicon Valley Bank and at First Republic will make it into the housing data in future months.
Today’s S&P CoreLogic Case-Shiller Home Price Index for “February” is a three-month moving average of home sales that were entered into public records in December, January, and February.
The list of year-over-year price decliners keeps getting longer. Prices are now down in 8 of the 20 metros that the Case-Shiller Home Price Index covers, double the 4 metros a month ago (percentage in parentheses reflects the year-over-year change the prior month):
- San Francisco Bay Area: –10.0% (from -7.7%)
- Seattle metro: -9.3% (from -5.1%)
- San Diego metro: -4.1% (from -1.3%)
- Portland metro: -3.2% (from -0.5%)
- Las Vegas: -2.6% (from +0.4%)
- Phoenix: -2.1% (from -0.01%)
- Los Angeles: -1.3% (from +1.0%)
- Denver metro: -1.2% (from 0.0%)
Prices are down the most from their respective peaks (ranging from May to July 2022) in these metros:
-
- Seattle: -16.5%
- San Francisco Bay Area: -16.3%
- Las Vegas: -10.9%
- Phoenix: -10.4%
- San Diego: -10.1%
- Denver: -8.8%
- Portland: -8.7%
- Dallas: -8.5%
- Los Angeles: -7.3%
- Boston: -5.6%……
*****
Continue reading this article, at Wolf Street.
TAKE ACTION
As we move through 2023 and into the next election cycle, The Prickly Pear will resume Take Action recommendations and information.
This article is courtesy of ThePricklyPear.org, an online voice for citizen journalists to express the principles of limited government and personal liberty to the public, to policy makers, and to political activists. Please visit ThePricklyPear.org for more great content.