The Most Splendid Housing Bubbles in America: July Update
By Wolf Richter
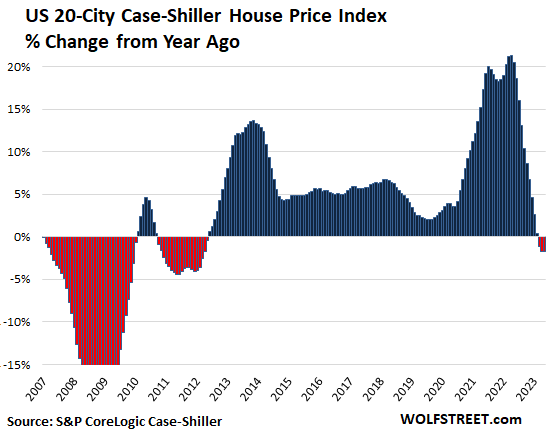
3rd Year-over-Year Price Drop in a Row. Monthly Increases Are “Just Seasonal”: Robert Shiller
Home price rise since 2012 “may be coming to an end”: Shiller. Biggest YoY drops: Seattle, San Francisco, Las Vegas, Phoenix, San Diego, Portland, Denver, and Dallas.
“Probably what’s happening with the increase in home prices, it’s just seasonal, it’s the summer, typically it [the Case-Shiller National Home Price Index] is going up in the summer,” Robert Shiller, one of the guys that developed the Case-Shiller Home Price Index, told CNBC yesterday.
It “has been just growing ever since 2012, about 10 years in the US of steady growth in home prices,” he said. “But it may be coming to an end with the advent of this interest-rate rising cycle.”
It was the second time in the interview that Shiller used the phrase, “may be coming to an end.” Moments earlier he’d said: “The fear of interest rate increases has influenced people’s thinking — it’s not just the homeowners, it’s new buyers who wanted to get in before the interest rates went up even more. They wanted to lock in. So that’s been a positive influence on the market. But it’s coming to an end,” he said.
Today’s S&P CoreLogic Case-Shiller Home Price Index for “May” is a three-month moving average of home prices whose sales were entered into public records in March, April, and May – so that’s smack-dab in the spring selling season, when prices always rise from the prior month, even during Housing Bust 1. And given the lag in the Case-Shiller Index, the spring selling season is reported in the summer, and “typically it is going up in the summer,” as Shiller said.
On a month-to-month basis, the 20-City Case-Shiller Index rose 1.5% in May from April, but it wasn’t enough, and compared to a year ago, it fell by 1.7%, the third month in a row of year-over-year declines, and the biggest since 2012:
Half of the 20 cities in the index had year-over-year declines:
- Seattle: -11.3%
- San Francisco Bay Area: -11.0%
- Las Vegas: -7.8%
- Phoenix: -7.6%
- Portland: -5.1%
- Denver: -4.9%
- San Diego: -4.2%
- Dallas: -3.8%
- Los Angeles: -3.1%
- Washington DC: -0.1%……
*****
Continue reading this article at Wolf Street.
TAKE ACTION
As we move through 2023 and into the next election cycle, The Prickly Pear will resume Take Action recommendations and information.
This article is courtesy of ThePricklyPear.org, an online voice for citizen journalists to express the principles of limited government and personal liberty to the public, to policy makers, and to political activists. Please visit ThePricklyPear.org for more great content.