The Most Splendid Housing Bubbles in America, June Update
By Wolf Richter
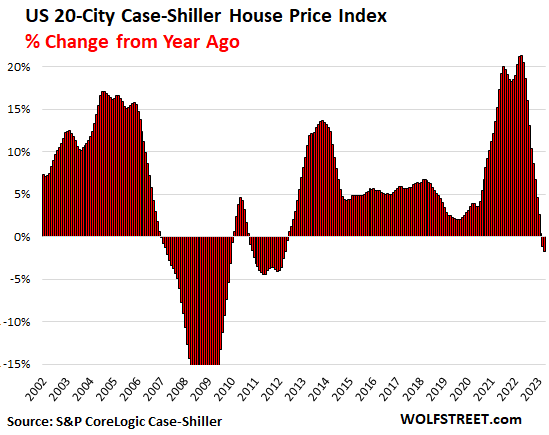
2nd Overall YoY Price Drop since 2012. Biggest in Seattle, San Francisco, Las Vegas, Phoenix, San Diego, Portland, Dallas…
It’s spring selling season, when prices always rise month-to-month, and they did, but it wasn’t enough.
It’s still spring selling season when sales volume and prices nearly always rise on a month-to-month basis, and they did this spring too, but not enough, and compared to a year ago, the 20 cities in the S&P CoreLogic Case-Shiller Home Price Index, released today, fell by 1.7%, the biggest year-over-year decline since 2012, following the 1.1% decline in the prior month, after the gigantic Fed-money-printer gains during the pandemic. The 20-City Index is now down 3.5% from the peak last June:
Today’s data for “April” is a three-month moving average of home prices whose sales were entered into public records in February, March, and April. That’s the spring selling season, when prices always rise from the prior month, and did so even during Housing Bust 1.
On a month-to-month basis, the 20-City Index rose 1.7% in April from March, but that was a lot less growth than in April 2022 (+2.3%) and in April 2021 (+2.2%), which is why year-over-year, prices fell further:
The list of year-over-year price decliners keeps getting longer. Prices are now down in 10 of the 20 metropolitan areas that the S&P CoreLogic Case-Shiller Home Price Index covers. Here are the metros with year-over-year price declines:
- Seattle: -12.4%
- San Francisco Bay Area: -11.1%
- Las Vegas: -6.6%
- Phoenix: -6.1%
- San Diego: -5.6%
- Portland: -5.2%
- Denver: -4.5%
- Los Angeles: -3.2%
- Dallas: -2.9%
- Washington DC: -0.5%
Prices in 19 of the 20 markets have dropped from their respective peaks (ranging from May to July 2022). The exception is the New York City metro, which squeaked past its prior high of July 2022. From their respective peaks, prices have dropped the most in these metros:
- Seattle: -12.9%
- San Francisco Bay Area: -12.0%
- Las Vegas: -9.9%
- Phoenix: -9.4%
- Dallas: -8.5%
- San Diego: -6.1%
- Portland: -6.0%
- Denver: -5.6%
- Los Angeles: -4.2%
- Tampa: -3.0
*****
Continue reading this article at Wolf Street.
TAKE ACTION
As we move through 2023 and into the next election cycle, The Prickly Pear will resume Take Action recommendations and information.
This article is courtesy of ThePricklyPear.org, an online voice for citizen journalists to express the principles of limited government and personal liberty to the public, to policy makers, and to political activists. Please visit ThePricklyPear.org for more great content.