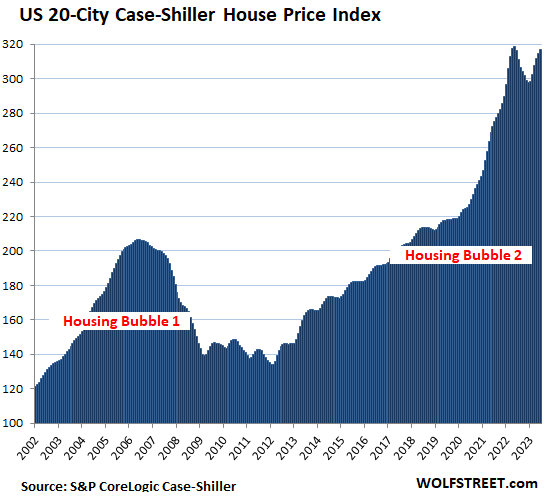
The Most Splendid Housing Bubbles in America, September Update: Spring Bounce Fades. 20-City Index -0.6% from Peak in 2022, Flat Year-over-Year
By Wolf Richter
San Francisco -11% from the peak, Seattle -10%, followed by Las Vegas, Phoenix, Portland, Denver, Dallas, San Diego, Los Angeles, and Tampa.
The S&P CoreLogic Case-Shiller Home Price Index, released today, for the 20 metros it covers ticked up 0.6% in July from June, the smallest month-to-month increase since February, continuing the trend of ever-smaller month-to-month increases following the powerful bounce in the spring, when three months in a row, the month-to-month jumps were 1.5% or higher.
Compared to the peak in June 2022, the index was down 0.6%. Year-over-year, the index was essentially flat.
Today’s index for “July” is a three-month moving average of home prices whose sales were entered into public records in May, June, and July. That’s the time frame we’re looking at here.
Prices were down from their peaks in 2022 in 10 of the 20 metros in the index (% from peak):
- San Francisco Bay Area: -10.8%
- Seattle: -10.1%
- Las Vegas: -7.2%
- Phoenix: -6.7%
- Portland: -4.5%
- Denver: -4.3%
- Dallas: -4.1%
- San Diego: -2.5%
- Los Angeles: -1.7%
- Tampa: -0.8%
Prices set new highs in 10 of the 20 metros in the index (% YoY):
- Chicago: +4.4%
- Cleveland: +4.0%
- New York: +3.8%
- Detroit: +3.2%
- Atlanta: +2.2%
- Washington DC: +1.9%
- Miami: +1.9%
- Charlotte: +1.8%
- Boston: +1.3%
- Minneapolis: +1.0%
*****
Continue reading this article at Wolf Street.
Image Credit: Dreamstime
TAKE ACTION
As we move through 2023 and into the next election cycle, The Prickly Pear will resume Take Action recommendations and information.
This article is courtesy of ThePricklyPear.org, an online voice for citizen journalists to express the principles of limited government and personal liberty to the public, to policy makers, and to political activists. Please visit ThePricklyPear.org for more great content.