You Will Never Guess What Happened to the “Strong US Consumer” After Today’s Huge GDP Revisions
By Tyler Durden
It has become a running joke: the “strong” Bidenomics economy comes with an expiration date, as it is only “strong” for about a month, at which point the initial “strength” is downgraded, and the data is revised sharply lower.
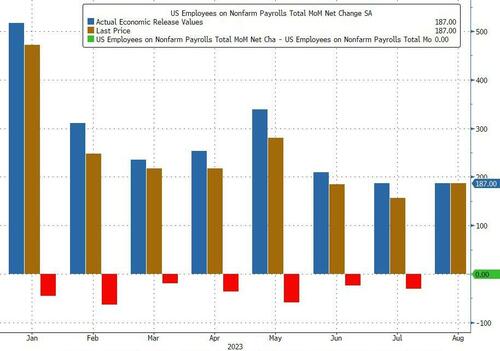
That has certainly been the case with US labor data, as we first reported last month, every single monthly payroll print in 2023 has been revised lower (see chart below), a 12-sigma probability and virtually impossible unless there was political pressure to massage the data higher initially and then revise it lower when nobody is looking.
But the BLS is not done: as we reported last week, besides the now traditional one-month lookback revisions the ridiculously high monthly payrolls prints accumulated over the past year will also be slowly but surely revised gradually lower at annual benchmark revisions for years to come. As Morgan Stanley chief US economist Ellen Zentner explained (full note available to pro subscribers)…
Payrolls get revised too, and we expect a downward revision. Payrolls have an annual benchmark revision that is published in February each year. The revision adjusts the level of payrolls through March of the prior year. For example, a new revision will be published in Feb-24, adjusting payroll levels from April-22 to Mar-23. And a preliminary estimation of the upcoming revision points to a decrease in payroll YoY% growth rates of -0.2pp.
But while downward payroll revisions under Bidenomics are as certain as death and taxes, what we wanted to discuss here are the just as striking downward revisions to US consumption which hit this morning alongside the comprehensive once every-five-years historical revisions to GDP. As a reminder:
Today’s release presents results from the comprehensive update of the National Economic Accounts (NEAs), which include the National Income and Product Accounts (NIPAs) and the Industry Economic Accounts (IEAs). The update includes revised statistics for GDP, GDP by industry, GDI, and their major components. Current-dollar measures of GDP and related components are revised from the first quarter of 2013 through the first quarter of 2023. GDI and selected income components are revised from the first quarter of 1979 through the first quarter of 2023.
Earlier today we already noted the disaster that was Q2 Personal Consumption: instead of the 1.7% unchanged print from the second estimate of Q2 GDP, the final number was a dire 0.8%, a 9-sigma miss to estimates…
But what about other historical data? After all today’s revision impacted all data from Q1 2013? Therein, as the bard says, lies the rub.
Let’s start with personal consumption, and compare the latest post-revision current data (link) with the most comprehensive pre-revision data as of last month (link). It should come as no surprise to anyone that with the (slight) exception of just Q4 2022, personal consumption in every single quarter since the start of 2022 – when the Fed aggressively started tightening and hiked rates by the most since Volcker – has been revised lower, and in some cases dramatically so.
Bloomberg also picks up on the GDP revision and looking at revisions to the historical data, writes that “the pandemic contraction is seen as being a bit less severe than previously thought: GDP is now reckoned to have dropped at a 28% annual clip in the second quarter of 2020, instead by 29.9%, as the government shut down swathes of the economy to fight the spread of the virus. But the recovery since then has been somewhat slower, according to the update. Growth last year was revised to 1.9% from 2.1%.” And of all GDP components, consumption was the weakest.
So not only was the Fed hiking at a time when personal consumption would grow much less period to period than previously expected, but the US economy was generally weaker than previously expected (as discussed here).
There’s more.
When looking at the composition of the US household’s income statement – the summary of economic accounts – we find just what we had expected: US savings were in fact far lower than previously expected.
In the latest negative revision, US households saved $1.1 trillion less than previously thoughtover the past six years…..
*****
Continue reading this article at ZeroHedge.
TAKE ACTION
As we move through 2023 and into the next election cycle, The Prickly Pear will resume Take Action recommendations and information.
This article is courtesy of ThePricklyPear.org, an online voice for citizen journalists to express the principles of limited government and personal liberty to the public, to policy makers, and to political activists. Please visit ThePricklyPear.org for more great content.