WHOOSH, Dollar’s Purchasing Power Goes to Heck as Services Inflation Takes Off, Food Spikes, Energy Explodes, But Used Cars Finally Stall
By Wolf Richter
The Fed is still pumping fuel on the fire.
The Consumer Price Index today – a measure of how fast the dollar and everything denominated in dollars, including labor, lost its purchasing power – is a horror show, the likes of which the majority of Americans have never experienced in their lives. The reality on the ground is even worse for many people because CPI is slow to pick up the red-hot housing inflation as we’ll see in a moment, and because CPI structurally is skewed to represent the inflation felt by higher-income households, while lower-income households, as Fed governor Lael Brainard pointed out last week, face higher inflation and feel it much more.
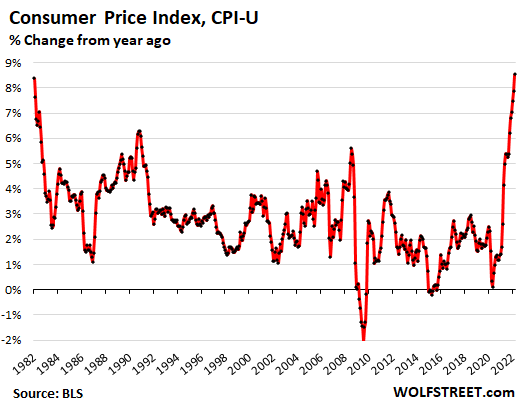
The overall Consumer Price Index (CPI-U) spiked by 1.2% in March from February, and by 8.5% from a year ago, the worst since 1981, according to data released by the Bureau of Labor Statistics today.
But in 1981, the Fed was effectively cracking down on inflation with double-digit policy interest rates, and inflation was on the way down.
Now inflation is spiking, and the Fed is still repressing short-term interest rates to near 0%, and it still holds $8.9 trillion in assets on its balance sheet as a result of years of money printing, including $4.8 trillion that it printed over the past two years to repress long-term interest rates and to produce the biggest wealth disparity ever. And now we’re surprised by this spike in inflation?
There is no period in history that compares to this period, not even the 1970s because the Fed wasn’t printing money in the 1970s.
WHOOSH goes the Dollar’s Purchasing Power.
Consumer price inflation is not a sign of anything positive, but a sign of the loss of the purchasing power of the consumer’s dollar, including the purchasing power of labor. And it’s cumulative, month after month, year after year. In March, the purchasing power of $100 in January 2000 dropped to a new record low of $58.80, which explains why the mood of Americans has curdled:
Inflation in services is now spiking.
The CPI for services – which includes housing costs – jumped by 0.7% in March from February, the third jump in a row of this magnitude, and by 5.1% compared to March last year, the worst services inflation since 1991. Given how slow the CPI is in picking up the surging housing costs, this portion of the CPI will continue to get worse, even as prices of gasoline and used cars might come down some.
Inflation in housing costs.
The largest component in CPI is “shelter,” a basket of services that is designed to represent housing costs and accounts for 32.7% of total CPI. The largest components in this basket are “Rent of primary residence,” accounting for 7.3% of total CPI, and “Owner’s equivalent rent of residence,” accounting for 24.0% of total CPI.
“Rent of primary residence” jumped by 4.4% in March (red in the chart below). This tracks what tenants reported as their actual rent payments, including in rent-controlled apartments.
“Owner’s equivalent rent of residences” rose 4.5% (green line). This tracks the costs of homeownership as a service, based on what homeowners reported that their home would rent for.
Because both of these rent measures are lagging, they will continue to spike as they catch up, even if over the next 12 months housing inflation actually were to cool down a little. So these housing components that weigh much more heavily than used cars or gasoline are guaranteed to provide upward pressure on CPI well into 2023 (my discussion of this phenomenon).
Note that both measures are still well below the overall CPI and therefore are still holding down CPI, but less than before, and as they rise, they will hold down CPI even less.
*****
Continue reading this article at Wolf Street.
This article is courtesy of ThePricklyPear.org, an online voice for citizen journalists to express the principles of limited government and personal liberty to the public, to policy makers, and to political activists. Please visit ThePricklyPear.org for more great content.