Biden Regime Looking To Ban Gas Stoves thumbnail

Biden Regime Looking To Ban Gas Stoves

By The Geller Report

Banning gas stoves. And fireplaces next. Bottom line is good ventilation is all that’s required.  Every good thing is in their crosshairs. Gas stoves have been in use since the late 1800s.

This is just more destruction to our economy and our way of life by the totalitarian primitives.

They claim it’s for the children, These are the same folks mandating deadly RNA vaccines for kids, genital mutilation and chemical castrations for children.

Banning Gas Stoves over Health Concerns

A federal agency may look to ban gas stoves over concern about the release of pollutants that can cause health and respiratory problems, according to a new report. The U.S. Consumer Product Safety Commission is set to open public comment on the dangers of gas stoves sometime this winter. The commission could set standards on emissions from the gas stoves, or even look to ban the manufacture or import of the appliances, commissioner.

Keep reading.

US Safety Agency to Consider Ban on Gas Stoves Amid Health Fears

Natural gas stoves, which are used in about 40% of homes in the US, emit air pollutants such as nitrogen dioxide, carbon monoxide and fine particulate matter at levels the EPA and World Health Organization have said are unsafe and linked to respiratory illness, cardiovascular problems, cancer, and other health conditions, according to reports by groups such as the Institute for Policy Integrity and the American Chemical Society.

Read more.

AUTHOR

Pamela Geller

RELATED ARTICLE: Elite University Department Bans Use Of Word ‘Field,’ Claiming It’s Too Racist

EDITORS NOTE: This Geller Report is republished with permission. ©All rights reserved.

Federal Aviation Administration Grounds All Domestic U.S. Flights thumbnail

Federal Aviation Administration Grounds All Domestic U.S. Flights

By The Daily Caller

All domestic flights in the U.S. were grounded overnight Wednesday into the morning due to a technical error. Some flights gradually started to resume shortly before 9:00 am (eastern time).

The Federal Aviation Administration (FAA) worked overnight to restore a system that allows air traffic control to alert pilots when there are potential hazards on their flight path. Normal air traffic operations resumed just before 9am on Tuesday while agents continued to look into the original cause of the issue, according to an update from the FAA.

Update 4: The FAA is making progress in restoring its Notice to Air Missions system following an overnight outage. Departures are resuming at @EWRairport and @ATLairport due to air traffic congestion in those areas. We expect departures to resume at other airports at 9 a.m. ET.

— The FAA ✈️ (@FAANews) January 11, 2023

“We are performing final validation checks and reloading the system now. Operations across the National Airspace System are affected,” the FAA wrote on Twitter. “We will provide frequent updates as we make progress.”

Roughly an hour after their initial tweet, the FAA sent an update to followers, announcing that the agency had “ordered airlines to pause all domestic departures until 9am Eastern Time,” to allow for research to be done on the “integrity of flight and safety information.”

Cleared Update No. 2 for all stakeholders: ⁰⁰The FAA is still working to fully restore the Notice to Air Missions system following an outage. ⁰⁰While some functions are beginning to come back on line, National Airspace System operations remain limited.

— The FAA ✈️ (@FAANews) January 11, 2023

Delays for arriving and departing domestic flights are likely to be substantial Wednesday, just a few short weeks after a significant winter bomb cyclone disrupted tens of thousands of flights through the holiday season.

Twitter users were quick to express concerns over the total shutdown of domestic travel, with the CEO of Evercontact writing, “This is alarming. There should be an independent audit on such a large-scale incident. Is it due to obsolete equipment? is it a hack? Human error? Accountability is key to restoring trust in an industry that can’t allow mistakes!”

The FAA then retweeted a post from White House press secretary Karine Jean-Pierre, who noted that “there is no evidence of a cyberattack at this point, but the President directed the Department of Transportation to conduct a full investigation into the causes.” She furthered that the FAA would continue to provide regular updates.

AUTHOR

KAY SMYTHE

News and commentary writer.

RELATED ARTICLE: Amtrak Trolls Southwest Airlines For Highly Questionable Free Ukulele Giveaway

EDITORS NOTE: This Daily Caller column is republished with permission. ©All rights reserved.

Lessons from the Southwest Debacle thumbnail

Lessons from the Southwest Debacle

By Tim Young

Does anyone else remember last October when Southwest employees went on a strike against the vaccine mandates and the airline tried to blame their mass cancellations on the weather . . . even though no other airlines were affected by said weather? That was the first thing that came to mind when I was watching every Southwest flight get canceled and the customer service lines grow throughout the airport as I was returning home from my Christmas travels.

Over Christmas weekend, many airlines had to cancel holiday flights due to the weather from winter storm Elliott. Not all airlines are created equal, however. Southwest Airlines had a striking number of cancellations compared to other airlines. While Delta canceled 9 percent of their flights, United canceled 5 percent, and American canceled less than 1 percent, Southwest Airlines canceled over 70 percent, amounting to more than 2,500 flights.

It’s hard to ignore the disparity in numbers between the airlines, especially if you’re one of the tens of thousands of people who received the great Christmas gift of getting stranded in the airport. So, what makes Southwest so especially awful? The difference was so apparent that even the Department of Transportation is now investigating the “unacceptable rate of cancellations” to see if they were actually out of the company’s control, which I don’t think will go well for the airline considering their history of coverups.

The Biden Administration even tweeted from the POTUS account, stating: “Thousands of flights nationwide have been canceled around the holidays. Our Administration is working to ensure airlines are held accountable. If you’ve been affected by cancellations, go to @USDOT’s dashboard to see if you’re entitled to compensation.”

Many disgruntled passengers took to social media to voice their complaints and travel horror stories about the airlines. From videos showing thousands of dumped suitcases to memes about Southwest’s less-than-helpful response to concerned travelers, there has been no lack of content inspired by the debacle.

On the bright side, Biden’s freakish former nuclear energy official Sam Brinton had already been caught and was (probably) unable to steal any of the thousands of bags that Southwest just left lying around.

The backlash led to the crashing of Southwest’s stock, which dipped nearly 6 percent as of Tuesday. Southwest CEO Bob Jordan attempted to avoid responsibility for the crisis, expressing surprise and shock with a statement in which he said the airline was facing “the largest-scale event that I’ve ever seen.”

Ever since the COVID lockdowns and the corporate vaccine mandates that followed, many businesses have not been able to recover, and large corporations like Southwest are no exception. In today’s world, traveling has become more inconvenient and disorganized than ever before. Even with the mask mandates gone from the airports and flights, the effects of the pandemic still linger.

Unlike many small businesses across the country, Southwest received massive support with over $7 billion in taxpayer aid during the pandemic. Despite the government’s help, Southwest has clearly struggled to sustain itself in post-pandemic America.

It turns out that when you shut down the country, incentivize people not to work, then force the remaining employees to get an experimental vaccine they don’t want, things don’t just snap back to normal—who would’ve thought?

The real issue now becomes whether or not this could ever change. Without strong leadership in this country—and a belief in self-governance and responsibility—things will only get worse.

*****

This article was published by American Greatness and is reproduced with permission.

Only Spiritual Brotherhood Can Save Men In The Job Crisis thumbnail

Only Spiritual Brotherhood Can Save Men In The Job Crisis

By Mark Warren

There’s a strange thing happening in the American economy right now — what we read in the newspaper or see on TV doesn’t match what we’re witnessing with our own eyes. Job numbers reported in the media seem wonderful. Amazingly low unemployment that hasn’t been witnessed in 50 years! Hundreds of thousands of new jobs created monthly. Yet for all these rosy numbers, when we look at the real world, we see critically understaffed businesses, long waits for repairs, and customer service in the gutter.

America’s young men are in crisis, and the answer to this problem is spiritual, not economic or political. While the media continues to trumpet good news about the economy, the reason your real-life experiences don’t match such optimism is because these reports typically only give you part of the picture. What corporate media doesn’t tell you is that about 11 million jobs remain unfilled right now.

That’s why service is lousy everywhere and you can’t get a plumber. Those jobs go unfilled because millions of young American men between the ages of 25 and 54 aren’t working. At all. As Bloomberg reports, they’ve been left behind, with a lower percentage of men between those ages working than in 1970 — a statistic that emerged before the economic disaster brought by coronavirus lockdowns.

Millions of Young Men Doing Nothing All Day

So, how can millions of men be out of work when unemployment is extremely low? Easy, if you don’t count them.

Yes, the unemployment rate hovers at a record low figure, but this number doesn’t count all unemployed people. It only includes those who don’t have a job and are actively seeking one. This cheery (and erroneous) unemployment rate doesn’t count the millions of young men who aren’t looking for a job. Young males fitting this description are often referred to as “NEETs,” an acronym originating in the U.K. that stands for “Not in Employment, Education or Training.” These fellows aren’t working and, worse, aren’t interested in work.

Of course, this was already a growing problem in the last decade. But unemployment went full supernova during the coronavirus lockdown — and finally smart people are paying attention to it. Mike Rowe of “Dirty Jobs” fame recently hosted a podcast discussion on the crisis of young men not working.

To further understand the problem’s depth, Rowe interviewed economist Nicholas Eberstadt, who wrote “Men Without Work.” It explains the seriousness of this issue, documenting how the unemployment crisis goes far beyond simply not having a job. Too many men in their prime have fallen into a hollow existence. And their parents — and our tax dollars — subsidize such incredible waste.

What do such men do with their copious amounts of leisure? According to Eberstadt, they aren’t only not working. They aren’t going to church. They typically aren’t dating. They aren’t engaging in charity work or civic activities either, or even helping with housework.

Instead, they play video games, binge watch TV and movies, and, perhaps most concerningly, abuse drugs. So many young men are not only lost to our economy, but lost to their families as well. They are at risk of becoming another gloomy statistic in the opioid epidemic.

Social and Spiritual Solutions

So, what is the answer? Unsurprisingly, it depends on who you ask. Eberstadt, the expert on young men dropping out of the economy, believes in secular and market-driven solutions to this crisis. He explains to Rowe on the podcast that we could use shame as a powerful motivator, much like our nation has shamed smokers to give up the habit.

But a campaign to shame men is already widespread in America — and not particularly helpful. In recent years, so many expressions of traditional male values have been labeled “toxic masculinity.” Combine this message with readily available drugs ranging from prescription opioids and fentanyl to legal marijuana in many states, and it almost feels like society is encouraging young men to disconnect from the real world and play “Call of Duty” all day.

We therefore believe the real solution to this crisis is spiritual. And we don’t mean just dragging young men away from the TV and into church. When Eberstadt’s book was first published in 2016, The New York Times highlighted it with an op-ed that made an eye-opening point about the root cause of the problem.

In the article, the journalist explored the issue via an interview with a young man who lost his job in the oil industry. He told the interviewer he feels as if America doesn’t care about him. He says he feels as if he’s “considered nothing.” This is a tragedy that likely resonates with millions of other young men not working. No shaming campaign will solve this. It will only worsen things.

Instead, these men would do well to unite. We suggest they form small groups with other men to help each other and provide non-judgmental spaces to work through life’s problems.

Form a Small Band of Brothers

I did this with several brothers a couple of decades ago — and continue to do to this day. Recently, I recounted what drove me to create such fellowship and how it’s transformed my life and so many others in the new book “Power of 4: How Christian Men Create Purposeful Lives By Not Going It Alone.”

If young men feel isolated and valueless, the answer is to bring them together in brotherhood to help them understand their worth. “Power of 4” emphasizes how much more powerful men can be when they don’t try to go it alone. When a man has three brothers to meet with regularly to work through life’s challenges, he is much better off than trying to handle his problems on his own.

Consider a hypothetical Power of 4 group comprised of men not in the workforce. They could work together to build each other up, for instance, by engaging in charity work while also collaborating on resumes and professional networking. (Simply having regular face-to-face contact with other men who are not keen on blaming themselves for their station in life will do worlds of good for young men in crisis).

An even more powerful approach to a Power of 4 group might be to mix together men with established careers with those not in the workforce. Young men who feel lost and without purpose could get unimaginable benefits from spending time with men who are on solid footing in their profession. Such successful men might even assist their Power of 4 brother by arranging an internship or introductory position.

What’s more, men currently working know just how nearly every employer is screaming out for quality employees now. That means a resume with some gaps in it won’t necessarily hold back a man who wants to better his situation. Undoubtedly, our young men in crisis can transform their lives once they realize they do have value — and even the potential for greatness. All it takes is a determination to relinquish those behaviors holding them back — whether it be drugs and alcohol or Netflix and PlayStation (or all of the above!).

Ultimately, we are deeply concerned by the crisis of young men dropping out of society. Despite so much bad news, we see many positives in the future. If men come together to support each other, this problem can and will correct itself.

With the right support system, young men can achieve tremendous personal growth. Every human has value, a fact lost on so many men for far too long. With the help of three brothers, our blueprint for the Power of 4, and our Lord and Savior Jesus Christ, American men will return to a society that so desperately needs them.

*****

This article was published by The Federalist and is reproduced with permission.

In 2022, The IRS Went After the Very Poorest Taxpayers thumbnail

In 2022, The IRS Went After the Very Poorest Taxpayers

By The Geller Report

And so many of them vote Democrat — Stockholm Syndrome.

I am sure they are comforted in their freezing beds in the knowledge that Ukraine is living large on their dime.

In 2022, the IRS Went After the Very Poorest Taxpayers

By: Liz Wolfe, Reason Magazine, January 5, 2023: (thanks to Van):

Despite $80 billion in new funding, the agency is living up to its reputation of hassling low-income taxpayers over rich people.

On Wednesday, Syracuse University’s Transactional Records Access Clearinghouse (TRAC) released data provided to it by the Internal Revenue Service (IRS) on audits performed by the agency in fiscal year 2022. Despite the infusion of new funding earmarked for the IRS via last year’s Inflation Reduction Act, the agency continued historic trends of hassling primarily low-income taxpayers, with relatively few millionaires and billionaires getting caught up in the audit sweep.

“The taxpayer class with unbelievably high audit rates—five and a half times virtually everyone else—were low-income wage-earners taking the earned income tax credit,” reported TRAC, noting that the poorest taxpayers are “easy marks in an era when IRS increasingly relies upon correspondence audits yet doesn’t have the resources to assist taxpayers or answer their questions.”

In fact, “if one ignores the fiction of auditing a millionaire through simply sending a letter through the mail, the odds that millionaires received a regular audit by a revenue agent (1.1%) was actually less than the audit rate of the targeted lowest income wage-earners whose audit rate was 1.27 percent!”

The Inflation Reduction Act, passed in August 2022, directed $80 billion worth of new funding over the next decade to the IRS so it could hire 87,000 new workers, purportedly to better target millionaire and billionaire scofflaws. The Biden administration and credulous journalists claimed that this would in no way increase audits for those making under $400,000 annually—suspect assurances not provided within the text of the actual bill. This increased capacity meant only those at the top would be targeted, supporters insisted. But this ignores how the IRS’s incentives work and how agencywide reform might be too heavy of a lift.

Correspondence audits—which are conducted via mail, and are the type frequently used when interacting with the poorest of taxpayers—are much easier and cheaper to conduct than other types of audits. Plus, the earned income tax credit is easy to get wrong. The nonpartisan Congressional Budget Office estimates that new hires with experience in the field will take almost three years of ramp-up time, with more junior new hires taking longer. The lag time between 2022’s infusion of funding, and legitimately increased capacity, will be enormous—if the agency can even snag the best in the industry when TurboTax and H&R Block will surely be swelling their own ranks. It makes sense that, given a dearth of experienced auditors not likely to be fixed soon, the agency would rely on the easiest and least time-consuming types of audits.

But be suspicious of the idea that an infusion of cash will solve longstanding problems within the IRS. This is, after all, the agency that sent $1.1 billion in child welfare payments to the wrong people over the course of merely five months during the pandemic. It’s the agency that was hacked back in 2015, resulting in the personal information of more than 700,000 taxpayers being compromised. It’s the agency that has been foolishly going after Americans who hold $10,000 or more in a foreign bank since 2010, never mind the fact that many of them are middle-class expats, not folks with yachts in the Mediterranean. And it’s the (leaky) agency that enabled the richest Americans’ intimate financial information to be thumbed through by ProPublica readers. It will take more than a little cash to fix all this, and, as the IRS’s competence and tenacity increase, so too will the tenacity of the vast infrastructure of accountants and lawyers hired by the rich to creatively minimize their tax burdens.

AUTHOR

Pamela Geller

RELATED TWEET:

Watch: Newly-elected Speaker Kevin McCarthy: “I know the night is late, but when we come back, our very first bill will repeal the funding for 87,000 new IRS agents.” pic.twitter.com/1IAbz27NsR

— TV News Now (@TVNewsNow) January 7, 2023

EDITORS NOTE: This Geller Report is republished with permission. ©All rights reserved.

Understanding Today’s Economy and Financial Markets thumbnail

Understanding Today’s Economy and Financial Markets

By Mark Wallace

Editor’s Note: The Prickly Pear published a related article last week on January 3 entitled The Price of Easy Money Now Coming Due. We recommend reading both articles together to understand current economic conditions and our readers’ concerns about personal financial situations.

When it comes to the economy, nearly the entire populace is of the same mind.  Almost all of us like economic expansions and booms and almost all of us dislike recessions and depressions.  For decades the federal government and the Federal Reserve have accommodated these desires.  A few interruptions have occurred, namely, the 1987 crash, the bursting of the tech bubble in 2000-2002, and the mortgage-backed securities meltdown in 2007-2008.  But by and large, it’s been onward and upward from, say, 1982 to approximately the middle of 2021.

The Fed has fueled the expansion and booms by fostering the expansion of credit and debt, by creating money out of thin air through open market purchases of U.S. Treasury obligations, and by keeping interest rates significantly below the levels that would prevail but for the two aforementioned policies.  Congress has done its part by running enormous budget deficits almost every year since the onset of the Great Depression.

An expansion of total credit and debt on a nationwide basis creates an economic expansion because virtually no one borrows money to put it under a mattress.  It is borrowed to be spent, either by buying consumer goods and services or by investing in assets such as stocks,  bonds, real estate, etc.  Individual and corporate debtors occasionally end up bankrupt, but as long as the overall amount of credit and debt is growing nationally, the expansion continues.

Note, though, that this is a two-way street.  Should the total amount of credit and debt contract on a nationwide basis, the economy will contract as well.  Money paid to a creditor where the creditor does not re-loan the money to someone else is money that the debtor no longer possesses to buy consumer goods and services or to invest.

A somewhat similar force is at work in the stock and bond markets.  If the price of stocks and bonds is rising, the investor holding the stocks and bonds becomes wealthier and is in a better position to both buy consumer goods or invest in financial assets (including real estate).  This also is a two-way street.  A decline in stock and bond prices diminishes wealth and, generally speaking, may make it more difficult for the investor to purchase consumer goods or more stocks and bonds.

The Fed and the U.S. government have striven mightily to keep the economic expansions going and to ensure that stock and bond prices rise in the long run.  One of the enduring mysteries is how —until recently — the government has been able to print vast quantities of money out of thin air without causing rip-roaring consumer price inflation.  This mystery can be solved by focusing on the different ways in which the wealthier and the poorer elements of the population spend money.

Imagine you have one billion dollars and are given a choice:  either give the entire one billion dollars to a tech billionaire or, alternatively, give $1,000 apiece to one million U.S. citizens chosen at random.  What are the differences in how the money is spent?  Will the billionaire use part of his new one billion dollars to buy a big-screen TV?  Probably not.  He likely already has as many big-screen TVs as he cares to own.  The tech billionaire is more apt to invest his new billion in some fashion.  Now, some of that money will go into the real (as opposed to the financial) economy (building a new factory and hiring workers, for example), but the fact remains that more of the billionaires new billion is likely to go into the financial economy than the collective billion of the million average Americans who receive $1,000 apiece.  The average American is more likely to use their windfall to spend on consumer goods and services, to take vacations, etc. as opposed to investing in stocks and bonds.

The upshot is that it’s possible to print gigantic quantities of money without creating consumer price inflation as long as policies are put into place to keep the wages and salaries of America’s middle and working classes stagnant and low.  And this is precisely what’s been happening since around 1982.  Keep the average guy broke, and you can print vast quantities of money without creating a lot of consumer price inflation.  Among those policies are the following:  exporting good manufacturing jobs to other countries; bringing in hordes of immigrants to keep wages low under the ironclad law of supply and demand; creating vast amounts of student loans to turn the newly-minted graduates into a form of indentured servants once they enter the workforce; and that old reliable, union-busting.  In the January 5, 2023 edition of the New York Times, there was an article on the op-ed page by Peter Coy entitled “The Fed Doesn’t Want Your Pay to Catch Up to High Inflation.”  Of course not — keep those wages and salaries of average Americans low so that Congress can continue to run huge budget deficits and the Fed can continue to print vast quantities of money without creating much in the way of consumer price inflation.

And where does a great deal of that printed money go?  It goes into financial assets (including real estate).  Hence we have a Dow Jones Industrial Average that has risen from approximately 900 in 1982 to over 30,000 today.

These policies have been greatly aided by technological advances.  It’s now possible to pay bottom-basement wages without creating widespread starvation in the working classes.  We live in a society where even many of the destitute are obese.

For decades it looked like the U.S. government and the Fed had a perpetual motion machine.  The economy kept booming and the prices of stocks and bonds continued marching upward (except for the aforementioned retreats in 1987, 2002, and 2008).

And then came the Covid pandemic and the re-emergence of significant consumer price inflation.

What happened during the pandemic, in a nutshell, was that (1) production of goods and services was greatly reduced, and (2) large amounts of cash were passed out to the nation’s average Americans.  It was the perfect formula for consumer price inflation, and that is what we got.   Average Americans began spending that new money in the real (as opposed to the financial) economy in an environment where the supply of goods and services had been curtailed.  Higher demand and lower supply imply higher prices.

The initial response of the Fed and politicians was to pooh-pooh the CPI increases as “transitory,” but after that dog didn’t hunt anymore the Fed was forced to finally raise interest rates in a semi-serious manner.

We haven’t had a stock market crash yet, but individual issues have in fact seen stock prices reduced to crash-like levels.  As of this writing, Tesla’s 52-week high was 390.11; it’s now at 113.46; Google, 152.10, now 88.58; Apple, 180.17, now 127.03; Netflix, 592.84, then down to 162.71 and now back at 305.92.  Trillions of dollars of value in the equities market have evaporated.  Losses in the bond market have also been enormous (in the trillions) as interest rates advanced.

It’s beginning to look like the perpetual motion machine engineered by the Fed and the Treasury over the past 40 years is starting to go in reverse.

As the price of stocks and bonds retreats, the buying power of those who hold those stocks and bonds is diminishing.  As the late Richard Russell may have said, the ammo boxes of the investing classes are starting to empty.  It’s been a slow burn — trillions have been lost, but the volatility index (the VIX) remains relatively low.  There’s no panic yet.  Paradoxically, this is a very bad sign indeed for the equity and bond markets.  Another aphorism from Mr. Russell is apt here:  “The Bear likes a full elevator when he presses the down button.”  The Bear certainly has that now.  Stocks and bonds may be of great value at some time in the future, but prices can’t rise very much if there’s little or no buying power when that time finally arrives.

The other big part of the equation is credit and debt.  The gigantic amount of credit and debt that the Fed and the federal government have nurtured into existence is the fuel for a giant deflationary crash.  There are only three things that can happen to debt:  it can be repaid, it can be re-financed, or it can default.  The rising interest rates engineered by the Fed have increased the pressure on borrowers, and one wonders whether there is a tipping point when large portions of that credit come crashing down (notice: thereby reducing the buying power of creditors), creating an environment where repayment and re-finance of debt become rarer and rarer and default more common.

The all-important moment may be the moment when the Fed is put to a choice:  either (1) continue raising interest rates (or maintain them at their then-current level) for the purpose of reining in inflation even though the effect of that is to cause the stock market, the bond market and the economy to crash, or (2) lower interest rates to save stocks, bonds, and the economy, even though the cost of that is galloping inflation, where inflation rises from 7 or 8 percent per annum to 18 or 20 percent or more per annum. 

I will hazard a guess here and predict that in this situation, the Fed will opt for galloping inflation over a catastrophic crash and a new Great Depression.  If we see the Fed lowering interest rates after a major retreat in the stock market even though consumer price inflation remains high, we will likely know that the Fed has made its choice.

Will that all-important moment arrive in 2023 or sometime thereafter?  It’s difficult to say at the present time.  Perhaps the Fed will be able to engineer a soft landing, where inflation subsides, interest rates can come down, and recession is avoided.  An interested observer can continue to monitor monthly changes in the CPI, monthly changes in unemployment, and other economic statistics and make his or her own educated guess.

If there is one important market to keep a close eye on, it’s the gold market.  Major and persistent increases in the price of gold over $2,500 or $3,000 per troy ounce almost certainly will signal that the market believes the Fed is throwing in the towel in terms of fighting inflation and is doing whatever is necessary to prevent a crash and a new great depression.  If the economy remains troubled with inflation remaining high and there is suddenly a major upward surge in the price of gold, it can be inferred that the elite donor class knows the Fed has made its choice and which way things will be headed.   

*****

Mark Wallace is a long-time student of financial markets and a former Federal Bankruptcy Judge.        

Tech Companies Continue Massive Layoffs, Amazon Announces 18,000 Job Cuts thumbnail

Tech Companies Continue Massive Layoffs, Amazon Announces 18,000 Job Cuts

By The Geller Report

The labor figures coming out of the Biden government are pure fiction (like every thing coming out of this treacherous regime). The unemployment rate, for example, is artificially depressed by excluding people who stopped searching for a job. Everything they say is a lie. Look around, use your eyes and your brain and think.

WHAT IS THE REAL UNEMPLOYMENT RATE?

But the job market outlook is more complicated than that, because the headline unemployment figure is artificially depressed by excluding people who might only be earning a few dollars a week, but who want to find full-time work. It also does not encompass any workers who have stopped searching for a job because they are discouraged or caring for a child.

The Ludwig Institute for Shared Economic Prosperity shows the “true rate of unemployment” is much higher than those government figures suggest.

A labor market metric developed by researchers at the institute evaluates workers who they consider “functionally unemployed” – individuals who are looking for work and do not currently have a full-time job, but want one, or who do not earn a living wage, which is roughly $20,000 annually before taxes. In April, about 23.1% of the labor market was functionally unemployed.

That is still in line with pre-pandemic levels: According to the Institute, which was founded by former U.S. Comptroller of the Currency Gene Ludwig, the true level of unemployment in February 2020 was about 24.5%.

The figures are even higher for Americans of color. The true unemployment rate is about 26.5% for Black Americans and 25.7% for Hispanic Americans. By comparison, White Americans have a true unemployment rate of 22%. (FOX Business)

Amazon Announces 18,000 Job Cuts

Amazon informed staff on Wednesday that it plans to cut 18,000 jobs amid slowing consumer and corporate spending.

The cuts include workforce reductions already announced in November. The company had previously flagged that it would make additional cuts this year.

Tech Companies Continue Massive Layoffs

Wall Street Journal: Amazon layoffs will affect more than 17,000 employees, a higher number than the company initially planned and one that would represent the most reductions revealed so far during a wave of cutbacks at major technology companies, according to people familiar with the matter. The Seattle-based company in November said that it was beginning layoffs among its corporate workforce, with cuts concentrated on its devices business, recruiting and retail operations (Wall Street Journal). CNBC: Salesforce said Wednesday that it is slashing 10% of its staff and curtailing office space. The cloud-based software firm had over 79,000 employees as of December. The layoffs, part of a broader restructuring plan at Salesforce, are the company’s latest headcount reductions after it let go of hundreds of employees in November (CNBC).

AUTHOR

Pamela Geller

EDITORS NOTE: This Geller Report is republished with permission. ©All rights reserved.

Great American Family Network Is Bad News For The Hallmark Channel thumbnail

Great American Family Network Is Bad News For The Hallmark Channel

By Martin Mawyer

If anyone needed evidence that the majority of Americans are sick up to here with the woke agenda dished out by mainstream T.V., look no further than the Great American Family Network (GAF).

This week the network – which launched less than a year ago as a breakaway and competitor to the Hallmark Channel – announced that it ranked number one in total day ratings growth in households, up 113%, and in total viewership, up 116%, according to the Nielsen ratings. It also came first in primetime rating growth for households, up 128%.

Why is this Hallmark knock-off channel gaining so much viewership? The main reason is its wholesome faith and family programming and its departure from Hallmark’s gay-friendly programming, which has been turning away viewers for the past several years.

Candace Cameron Bure, one of the biggest stars of Hallmark, jumped ship last year and moved to GAF. She came under fire recently for daring to note that GAF would focus on “traditional marriage.” The predictable hell storm erupted and is still swirling around an unperturbed Bure, who is happily acting and producing at GAF.

During the December Christmas programming, Hallmark further turned off viewers with its first Christmas story focusing on a gay couple, called “The Holiday Sitter.” It tells the heartwarming story of Sam, who babysits his niece and nephew before the holidays, and finds unexpected romance when he recruits handsome neighbor Jason to help.

Did I say heartwarming? Sorry, I meant heartburn-inducing.

Hallmark may have made the biggest mistake of its previously saccharine life by deciding to pander to the homosexual lobby, which makes up a small minority of viewers while thumbing its nose at the millions of viewers who always flocked to Hallmark for family-friendly viewing.

We wonder, though, will Hallmark regret its gay programming decision enough to go back to its roots? It’s doubtful … but they’re probably squirming right now with the release of the latest Nielsen ratings.

EDITORS NOTE: This Christian Action Network column is republished with permission. ©All rights reserved.

The Federal Reserve’s Housing Market Lessons to Be Learned [Once Again] thumbnail

The Federal Reserve’s Housing Market Lessons to Be Learned [Once Again]

By Edward Pinto

Summary

The effects of the COVID-19 pandemic were unprecedented in terms of widespread lockdowns, skyrocketing unemployment, and a financial market crash. The Federal Reserve took aggressive expansionary efforts in the form of Zero Interest Rate Policy (ZIRP) and quantitative easing (QE) to stabilize the economy, while Congress enacted massive fiscal stimulus. However, one of the results was a runaway home price boom.

Recently Chairman Powell admitted that the Federal Reserve bore some responsibility for this boom, noting that:

“… the housing market was very overheated for a couple of years after the pandemic as demand increased and rates were low. … the housing market needs to get back into a balance between supply and demand.”

November 2, 2022, FOMC press conference; italics added

It is now generally acknowledged that the Federal Reserve ended up overshooting by not recalibrating its policies in light of both overwhelming fiscal and housing market responses.  Both of these fueled an explosion in aggregate demand, especially for goods and houses.

By the end of August 2020, near-real-time credit card data indicated that sales for July 2020 were up 2% on a year-over-year basis, indicating a recovery from the initial pandemic shock.  By mid-December 2020, these same data indicated that sales for late October 2020 to late November 2020 were up 6% on a year-over-year basis, signaling a policy-induced acceleration of demand. Spending in the lowest two quintiles of zip codes by income was growing at 13% and 9% year-over-year, reflecting the especially large fiscal stimulus for lower-income households.[1]

For the rest of our analysis, read the full report

PDF to full report


[1] In addition, stock and home prices were booming by late 2020.  The ensuing wealth effect, which develops with a lag, should have been well known to the Fed.

EDITORS NOTE: This AEI report is republished with permission. ©All rights reserved.

Investment Challenges Ahead in 2023 thumbnail

Investment Challenges Ahead in 2023

By Neland Nobel

In line with our promise to provide more guidance and opinions on personal finance,  the following is offered as our take on what 2023 will likely provide for investors. We hope to provide a little theory to develop your thinking and some actionable ideas. Keep in mind this is for educational and entertainment purposes only. Always do your own research and/or consult with a qualified financial professional before investing in anything.

Last year we suggested that it would be a risk-off year. We suggested that both stocks and bonds would have bear markets and the standard 60% stock, 40% portfolio, typically recommended for retired people, would fail.

Boy, did it ever. According to a chart created by the Financial Times, it was the worst year for both asset classes combined since 1871! Ouch!

Other sectors of the market that caught the public fancy, like cryptocurrencies, lost 70% of their value or more. The bloom not only came off the rose, but the rose proved poisonous.

Jason Goepfert and sentimentrader.com also determined that those who bought dips or rallies also fared poorly with the worst results since 1928. It was just a very difficult year.

Gold moved essentially sideways, which allowed it to outperform most other asset classes.  Oddly though, western investors continued to sell holding out of ETFs, while central banks were the biggest buyers since 1968, just before the collapse of Bretton-Woods. What do they know that we don’t?

In general, the whole of 2022 could be described as the year where all components of the “everything bubble” began to unwind. It was and remains a financial asset bubble of immense proportions blown up by years of easy money from the central bank and massive and irresponsible fiscal stimulus. started to unwind under the weight of rising interest rates triggered by the worst inflation in 40 years.

This is not a natural market phenomenon, but rather a crisis with political origin. It is not a market error, it is a central planning error committed by politicians and the FED.

Not surprisingly, with such outsized influence, what the FED does in 2023 will likely prove determinative.

While the current market is oversold and likely to rally early in the new year, we doubt it can sustain further gains in light of further increases in interest rates and the inevitable decline in earnings.

Many of the factors causing this unwind of the everything bubble, primarily the rapid rise in interest rates engineered by the FED, will continue to be important factors in the coming year. But we suspect returns for bonds will first improve substantially once rates peak to be followed by an equity rally later in the year. However, that improvement is more likely towards the second half of 2023, with the first half being rather brutal for equities.

History does not always repeat, but past business cycles show that stocks do not bottom until after the FED pivots to lowering interest rates. Even that does not guarantee a positive move in stocks since the reasons the FED will cut (poor business conditions) can adversely influence both corporate earnings and debt quality.

History also suggests that markets don’t swing from overvaluation to fair valuation.  The excessive swing upward is usually followed by an excessive swing downward.

Also, valuations usually have to get cheap before a bottom for equities is found.  In that regard, we are still not in the inexpensive zone of market valuations.

We don’t know when that will be or at what level it will be, nor does anyone else.  Almost all the major brokerage houses predicted this time last year the S&P would be near 5000. Instead, we are closing near 3800. However, we would be interested in equities if the S&P index were to get around 3,000. We don’t know if it will hit that. However, if it does, it would command our attention.

Inflation should start moderating soon. The housing component is about one-third of the CPI index and housing statistics indicate sharp weakness in this sector. The money supply is also actually contracting now. However, that simply means inflation will moderate. We doubt we will hit the 2% FED target level anytime soon, absent a bone-crushing recession.

A housing bust will also curtail consumer demand, not just for things like appliances and furnishings, but other things as well. The reason is a house is the biggest source of wealth for most families and when housing prices start to fall consumers both feel, and actually are, poorer than before. Sprinkle in some rising unemployment anxiety and consumers will likely pull in their financial horns in the first half of next year.  That is important because consumer spending is 70% of the GDP.

The debate about whether we are in a recession will likely be over by summer with the recession advocates fully vindicated.

So the good news is inflation for a while will moderate.  However, it will do so for all the wrong reasons: falling demand, falling housing prices, and rising unemployment.

What investments could be used under the circumstances described?  We would say bonds would be the first beneficiaries.

Most investors purchase bonds to diversify their risk and get hopefully some cash flow.  But bonds can at times be vehicles for capital gains.

To understand why you need to understand what is called duration.  Duration is basically a mathematical calculation that involves the coupon cash flow generated and the length of the bond to its final maturity date.

The bonds with the longest duration ( the longest maturity and the lowest coupon) are the bonds that will change the most in price given any change in interest rates.  As interest rates rise, bonds fall in price.  When rates begin to fall, bonds will rise in price.

Timing as always will be important, but if you can buy long-duration high-quality bonds (like the 30-year US Treasury bond) near the peak in rates, you stand to make good money once rates begin to fall.  When rates near the bottom, we would sell since the US Treasury is not in good financial shape long term. In that sense, this is an intermediate-term trading idea, not a long-term buy-and-hold idea.

In short, buying bonds will likely be the best trade for the first half of the year if you can buy right near the peak in interest rates.

Your financial adviser should be consulted to see if such a strategy applies to your own circumstances and to get his or her ideas on the subject.

For those who manage their own funds, investigate Vanguard Extended Duration Treasury EDV, Pimco Long term Zero coupon (ZROZ), and TLT as possible vehicles to develop a position for the eventual reversal of FED interest rate policy.

The ultimate leverage to exploit a drop in rates are the longest bonds available with the lowest (can’t get lower than zero) interest coupon. Hence, the zero coupon bond idea.

This trade may also act as a strategy to deal with uncertainty. If paired with gold, the investor is hedged against inflation, possible deflation, and rising default risk.

Since the condition of one usually leads to a counter move by the FED and the creation of the other, each side should eventually profit from the uncertainty.  We are not suggesting they be in equal proportion, but rather that both exist to some degree in the portfolio.

Yellen Blaming Consumers for Inflation Is Government’s Latest Attempt to Deflect Blame for Its Policies thumbnail

Yellen Blaming Consumers for Inflation Is Government’s Latest Attempt to Deflect Blame for Its Policies

By Jack Elbaum

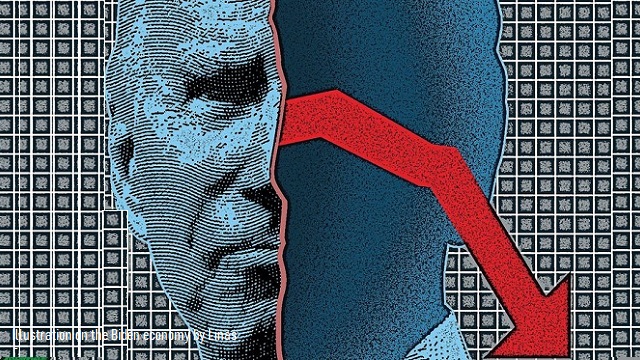
A few weeks ago, US Secretary of the Treasury Janet Yellen appeared on the Late Show With Stephen Colbert to discuss a range of issues both political and personal.

The most widely reported moment in the interview came when Yellen talked about practicing her signature (don’t ask me why this is newsworthy, I have no idea). However, a significantly more important moment has not gotten the attention it deserves.

When asked by Colbert to explain the reasons behind the worst inflation the US has experienced in 40 years, the former Federal Reserve chair blamed it primarily on rising consumer spending—Americans “splurging” on goods—at the start of 2021 once the Covid-19 lockdowns were lifted. This, compounded with supply chain issues and the war in Ukraine can sufficiently explain inflation, Yellen claims.

But can it really? Let’s take a closer look.

The Real Reason For Inflation

Yellen’s explanation is not wholly inaccurate; it is true that consumer spending rose above pre-pandemic levels at the start of 2021 and continued to rise at a notably fast rate for many subsequent months—which puts upward pressure on prices. At the same time, this is in no way a complete explanation of the inflation we are seeing now.

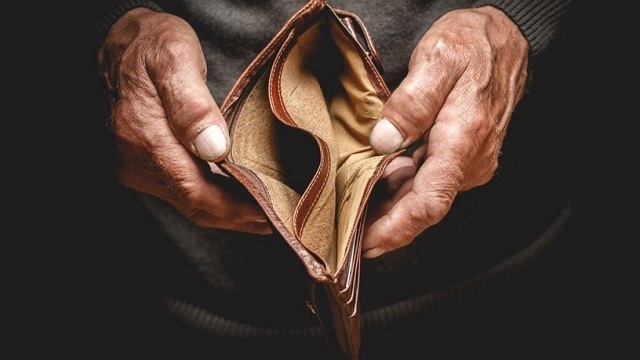
Yellen’s explanation does not capture inflation’s primary culprit, both in this case and historically: expansionary monetary policy. From February 2020 to February 2021, the money supply as measured by M2 (the broadest measure of the money supply) increased by 27 percent. It increased by another 11 percent from February 2021 to February 2022. This means that, over the first two years of the Covid pandemic, the money supply increased by 41 percent. To put that in perspective, from 2010 to 2019, this measure of the money supply rose by 5.8 percent annually.

In a 60 Minutes interview, Chairman of the Federal Reserve Jerome Powell replied “Yes, we did,” when asked if he simply “flooded the system with money” during the pandemic.

The consequence of such a drastic rise in the money supply is clear: a drastic rise in inflation.

The Evidence

The reason this is the case should be intuitive (increasing the amount of money in the economy boosts the relative demand for goods and services, which puts upward pressure on prices) but it can also be demonstrated theoretically and examined empirically using what is known as the quantity theory of money. This theory has roots that can be traced back hundreds of years but remains as relevant as ever today, with most economists accepting its core insight as accurate.

The quantity theory of money is based on the “equation of exchange”: MV=PY, where M is the quantity of money, V is the velocity of money (the average frequency at which a unit of money is used to purchase goods during a given period), P is the average price level, and Y is real GDP.

If the value of one side of the equation rises or falls, there must be a similar shift on the other side. Based on this, we can understand that there is a positive relationship between money supply and price level, all other variables held constant.

This is particularly true if we accept that a nominal variable such as money cannot influence a real variable like GDP (Y); it would mean that the entire impact of a rising money supply falls on price level, rather than price level and real GDP).

In the context of the economic developments since February 2020, it becomes clear why we now see inflation. M rose dramatically for a two year period; however, it initially did not cause a hike in the left side of the equation (MV) because of a decline in V at the start of the pandemic. But once V inevitably adjusted back to baseline as restrictions were lifted, MV rose and an increase in the left side of the equation (PY) was necessary in order for the identity to hold. The spike in price level (inflation) following a rapid rise in the money supply and a return of other variables to their baseline could have easily been predicted using this theory and equation.

Put simply, as the supply of any good, including money, increases, the value of that good will fall relative to the value of other goods. In other words, creating more money means money will have a lower purchasing power than if the money was not created.

That this is the proper explanation for inflation, and that the quantity theory of money remains valid, is borne out empirically. The graph below—created by two economists at Johns Hopkins University and presented in the Wall Street Journal—shows expected inflation based on the quantity theory of money equation (MV=PY) plotted next to actual inflation as measured by the GDP deflator over the past 60 years. The extent to which the two track is striking. The only deviation from the relationship took place at the start of the Covid-19 pandemic; but, by the middle of 2021, the equation of exchange was once again a near perfect predictor of inflation. This suggests that the quantity theory of money certainly reflects the real world workings of the economy in that price level is heavily influenced by money supply. It thus vindicates the proposition that the Federal Reserve’s expansionary monetary policy is the primary reason for inflation.

As a final note, it should be mentioned that all of this was exacerbated by expansionary fiscal policy. At the same time that the money supply was increasing, politicians in Congress passed several stimulus bills—nearly all of them topping a trillion dollars.

Astonishingly, these bills did not stop when inflation began. In March 2021, Democrats passed, and Joe Biden signed, the $1.9 trillion American Rescue plan which sent billions of dollars in direct stimulus checks. Then, in August 2022 the so-called Inflation Reduction Act was passed, which added more than $500 billion in new spending and tax breaks. Insofar as an increasing money supply enables increasing government spending, it puts upward pressure on prices, which means the inflation we see today really was a team effort between the Federal Reserve and Congress.

The Art of Shifting Blame

It should be self-evident that the explanation given above for inflation is not one that the people in charge of monetary and fiscal policy would be happy with. The reason is simple: it suggests they are culpable for the inflation we have experienced.

The first response was that it was merely “transitory.” Jerome Powell claimed, in March 2021, that “these [are] one-time increases in prices.” Yellen concurred saying, “I really doubt that we’re going to see an inflationary cycle.” Former White House Press Secretary Jen Psaki told reporters that inflation was only going to have “a temporary, transitory impact.”

All of these claims turned out to be completely untrue, as even those who pushed that idea at the start have now recognized.

Then, politicians including, but not limited to, Senators Elizabeth Warren and Bernie Sanders jumped on the idea that “corporate greed” was the real reason inflation was rising. As Brad Polumbo points out, though, the issue with this talking point is twofold: 1) “corporations are no more ‘greedy,’ aka profit-seeking, than they were 5 years ago or 10 years ago, when inflation wasn’t surging” and 2) producer prices have risen more than consumer prices, suggesting “companies haven’t jacked up prices to even fully match the increase in their costs, let alone exceed them.”

The “greedflation” argument amounts to nothing more than a politically-motivated conspiracy theory.

The White House has also taken advantage of Russia’s war on Ukraine to dub inflation “Putin’s price hike.” Nevermind the fact that inflation — including gas prices — were already up prior to Russia’s invasion, plenty of people went along with this line of argument anyway. This supply shock caused by the war would also be accounted for in the real GDP term of the equation of exchange. Since real output hasn’t yet fallen significantly in the US, it’s unlikely that this is the primary cause of inflation. It is true that the invasion has made inflation worse, but it is certainly not the cause of inflation.

And now, with Yellen’s recent interview, it seems that the narrative has shifted once again—to blaming inflation on Americans for spending too much.

There is a pattern here: no matter what happens, technocrats, bureaucrats, and politicians find a way to blame everything and everyone—except for their own policies and actions—for the situations we find ourselves in. This is true regarding inflation; this is true regarding school closures and subsequent learning loss; this is true regarding failed Covid-19 lockdowns.

Nobel Prize winning economist Milton Friedman could have (and did) predict this precise sequence of events almost 50 years ago.

He said that “If you listen to people in Washington (…) they will tell you that inflation is produced by greedy businessmen or it’s produced by grasping unions or it’s produced by spendthrift consumers.”

As we have seen, this is certainly still the case today. However, Friedman points out that the core issue with those ideas is that “neither the businessman, nor the trade union, nor the [consumer] has a printing press in their basement on which they can turn out those green pieces of paper we call money.”

So, what is the cause of inflation? Friedman argues: “Inflation is always and everywhere a monetary phenomenon, in the sense that it is and can be produced only by a more rapid increase in the quantity of money than in output.”

There is no better description of the period between February 2020 and February 2022. The government first shut down production during lockdowns—with residual effects being felt for a substantial period of time afterward due to the friction inherent in our economy—while simultaneously increasing the money supply at staggering rates.

The question we should be asking those in charge is simple: what other outcome could there have been other than rising inflation?

*****

This article was published by FEE and is reproduced with permission.

There’s A Massive Red Flag That Could Spell Disaster For Americans’ Pension Plans thumbnail

There’s A Massive Red Flag That Could Spell Disaster For Americans’ Pension Plans

By Laurel Duggan

U.S. government pension funds currently have the lowest cash holdings since the 2008 financial crisis, and corporate pensions’ cash holdings are barely above the 13-year low they hit in 2021, which could spell disaster in the event of a financial crisis.

Over the past 15 years, public pensions had 2.45% cash holdings and private pensions had 2.07% on average, but those have dropped to 1.9% and 1.7% respectively, according to The Wall Street Journal. The figures were higher even in 2008, when some retirement funds had to sell at inopportune times to make payments; one economist told the Daily Caller News Foundation this could threaten Americans’ pensions in the event of a financial crisis, which could force funds to sell off assets at low prices in order to continue payments, resulting in a massive loss in value.

The insolvency of many pension funds, which was caused by making promises that could never be paid, will eventually rear its head in a financial crisis — it is just a question of when the music will stop and who will be left without a seat,” E.J. Antoni, research fellow for regional economics at The Heritage Foundation, told the DCNF.

Keeping too much cash on hand can lower returns for pension funds, but keeping too little can end up forcing companies to sell assets at unfavorable prices just to keep cash on hand for payments, according to the WSJ. Low interest rates in recent years drove fund managers to exchange liquid cash for higher risk assets, failing to anticipate that rates would eventually rise, according to Antoni.

This is part of the classic boom-bust cycle caused by the Federal Reserve’s manipulation of interest rates. The overleverage is not limited to pension funds, however, which is one reason why most businesses have slowed hiring or begun layoffs,” Antoni told the DCNF.

The $307 billion California State Teachers’ Retirement System had the equivalent of eight and a half years worth of benefits in liquid non-cash assets in November, down from ten and a half years in July, according to the WSJ.

Some funds are now pushing to build up their cash on hand in anticipation of a rocky 2023, which will likely include another rate hike from the Federal Reserve and may induce a recession, according to the WSJ.

*****

This article was published by The Daily Caller and is reproduced with permission.

The Prickly Pear New Year’s Resolution thumbnail

The Prickly Pear New Year’s Resolution

By Neland Nobel

Most of us look at the end of the year, reflect on the past, and look into the future. Many of us have resolutions to do things better in the coming year.

At The Prickly Pear, we look at the economic horizon and we see storm clouds. That does not bode well for a society that is already badly divided and where one side seems to delight in unleashing criminals on the rest of us.

Economic trauma tends to make social stability more difficult in any case, but especially so when lawbreaking has been made into a form of acceptable social protest.

Therefore, we plan to use more space in the coming year on two topics: personal finance and personal safety.

We will explain later in greater detail why personal finance needs to be front and center. But the short version is this: given the recent election results and the betrayal of the House Republicans by Mitch McConnell, we just don’t see any principled and effective resistance to further spending on top of the excesses we have already seen. The result will likely be a recession and a severe debt crisis.  Likely we are too far along in this debt crisis now to resolve it without great pain. We had each better take care of ourselves or we won’t have much left with which to help the country.

In terms of crime, the Democrats have an agenda to change both the prosecutorial system, and the prison system, and attempt to redefine crime for the sake of “equality.” Couple this with probable privation, and you have a toxic mixture quite likely to lead to rising crime and a risk to private and public safety.

Therefore, we will be producing more articles on both subjects and increasing the number of videos on the subject as well.

We don’t wish to start off the new year on a pessimistic note, but we prefer to think of it as enlightened realism.

The good news is the debt crisis will likely be the only thing that brings our political elite to their senses. The bad news is, the rest of us are going to have to get through it.

If you prepare well and the worst does not happen, no harm, no foul. However, if you get caught blindsided, you may not be able to recover. Thus, a good dose of realism is the best posture to take at this time.

Congress Guts Budget Rules and Misses Chance to Cut Spending thumbnail

Congress Guts Budget Rules and Misses Chance to Cut Spending

By Matthew Dickerson

Republicans in Congress missed a huge opportunity to begin putting our country’s fiscal house in order.

Inflation caused by runaway government spending and money printing was the top issue on the minds of voters in the November midterm elections.

The Left’s reckless pursuit of these disastrous policies has been a boon for fiscally conservative politicians bold enough to honor their promise to the American people.

“Across the country, conservative candidates who offered courageous leadership and a clear policy agenda were rewarded,” Heritage Foundation President Kevin Roberts explained. “Candidates who focused solely on blaming President Joe Biden for the country’s problems, without offering any solutions, were disappointed.”

The lesson for politicians should be that they need to understand the issues that matter to American families, identify solutions to those challenges, and then boldly go on offense to achieve results by taking advantage of legislative opportunities.

The most important solution lawmakers could advance to address the country’s largest problem, inflation, is reducing government spending.

Republican lawmakers were handed a golden opportunity this week to single-handedly cut spending.

That’s because President Joe Biden’s $1.9 trillion American Rescue Plan Act–the spending bill that lit the inflationary fire–violated the Statutory Pay-As-You-Go rules put into place by President Barack Obama.

The Statutory PAYGO law requires deficit-increasing laws like the American Rescue Plan to be paid for with cuts elsewhere in the budget. If Congress doesn’t do its job, then the president is required to automatically carry out specified spending cuts.

Biden’s bill for his spending was set to come due in January, when the President would have been required to cut $132 billion out of the $6 trillion budget.

To reduce inflationary government spending, all Republican senators had to do was absolutely nothing. It would have been a perfect opportunity to help American families.

Of course, Biden wants to keep government spending as high as possible, inflation be damned. And some Republicans wanted to avoid the specific cuts required by Obama’s Statutory PAYGO law, which would include a 4% haircut to Medicare payments to providers.

They could have negotiated other spending cuts to replace the automatic reductions. The $80 billion IRS slush fund to add 87,000 agents would have been a popular place to start.

Because Republicans didn’t vote for the American Rescue Plan Act that triggered Statutory PAYGO rules (they didn’t vote for the Statutory PAYGO law either), they would have been totally blameless if Biden ultimately rejected common sense solutions and instead decided to enact the automatic spending cuts.

Republicans held all the leverage.

What ended up happening?

The massive omnibus spending bill introduced by the leadership of both parties in the Senate included a provision that simply turned off enforcement of the Statutory PAYGO rules not just this year, but next year as well. This would result in a $260 billion deficit-fueled spending hike.

Comically, the provision turning off budget enforcement rules were written in such a way that they violated another Senate budgetary rule.

Senator Rand Paul, R-Ky., raised a point of order, stating:

Today’s legislation breaks the Congressional Budget Act rules, so Congressional leaders have included in this monstrous spending bill language to simply waive the PAYGO rules. Congress has time and time again waived its own rules and the result has been over $31 trillion in debt, inflation, and a weakened economy. Let’s respect the American people by being responsible stewards of their tax dollars and adhering to our own budget rules.”

Unfortunately, 16 Senate Republicans and all Democrats voted to “waive all applicable budgetary discipline.”

Paul tweeted “That Point of Order was waived with the help of 16 REPUBLICANS. If it had been upheld, this monstrous spending bill would have been stopped until there were SERIOUS cuts.”

Eighteen Senate Republicans ultimately voted for final passage of the omnibus, pushing American taxpayers further into debt and increasing inflationary pressures.

Not taking advantage of the leverage to achieve results for the American people presented by Statutory PAYGO is a big, missed opportunity. One that will cost taxpayers hundreds of billions of dollars.

Next year will feature several important policymaking inflection points that should be opportunities for conservative lawmakers to reduce inflationary government spending by trillions of dollars, including the debt limit, government funding, and the farm bill.

The American people expect–and deserve–bold leadership. Congressional leaders must be prepared to seize these and every chance to slow the growth of government spending and save our country.

*****

This article was published by The Daily Signal and is reproduced with permission.

The Price of Easy Money Now Coming Due thumbnail

The Price of Easy Money Now Coming Due

By Wolf Richter

The Crazy Stuff & Asset Prices that arose during Easy Money are coming unglued as Easy Money ended.

The era of money-printing and interest-rate repression in the United States, which started in 2008, gave rise to all kinds of stuff, and the easy money kept going and kept going, and all this money needed to find a place to go, and then money-printing went hog-wild in 2020 and 2021. And the stuff it gave rise to just got bigger and bigger, and crazier and crazier. And much of this stuff is now in the process of coming apart, I mean falling apart, or getting taken apart in a controlled manner, and some stuff has already imploded in a messy way.  And we’ll get to some of this stuff in a minute.

All this money-printing and interest rate repression finally gave rise to massive consumer price inflation, and now we have a real problem, the worst inflation in 40 years, and way too much money still floating around all over the place with businesses, with consumers, with state and local governments. This means that this raging inflation has lots of fuel left to burn, and the government is making it worse by handing out hundreds of billions of dollars for all kinds of stimulus spending, from the new EV incentives to $50 billion handed to the richest semiconductor makers.

And some state governments are handing out inflation checks or whatever – in California, households can get up to $1,000. And they’re all spending this money, and thereby throwing fuel on the inflation fire. We’ve already seen automakers raise the prices of their EVs to eat up the EV incentives, and there we go, more inflation.

The poor Federal Reserve has to deal with all this, and it’s out there raising interest rates far more than anyone expected a year ago, and it’s doing quantitative tightening, and it’s saying all kinds of hawkish things, but the markets are blowing it off, and they’re not taking it seriously, which means that the cold water the Fed wants to throw on financial conditions, and therefore on inflationary pressures, isn’t getting there, and it has to throw a lot more cold water on it, so higher rates for longer, and maybe for a very long time.


The last time we had this kind of inflation, it took over a decade to calm it down, and interest rates went a lot lot higher than they’re today. I have the feeling that this raging inflation today will dish up lots of nasty surprises, which is what raging inflation does.

So now we got all the stuff that money-printing and interest-rate repression gave rise to, and this stuff must have continued money-printing and interest-rate repression to exist, but now we have soaring interest rates and the opposite of money-printing: quantitative tightening.

Perhaps the most spectacular creation of the money-printing era is crypto. It started with bitcoin in early 2009, just after the Fed’s money-printing got started. And the promoters fanned out all over the social media and everywhere and touted it as an alternative to the dollar and to fiat currency in general and to what not, and people started hyping it, and promoting it, and they’re trading it, and the price shot higher.

And then come the copycats since anyone can issue a cryptocurrency. Suddenly there were a dozen of them, and then there were 100 of them then 1,000, and suddenly 10,000 cryptos, and now there are over 22,000 cryptos, and everyone and their dog is creating them, and trading them, and lending them, and using them as collateral, and all kinds of businesses sprang up around this scheme, crypto miners, crypto exchanges, crypto lending platforms, and some of them went public via IPO or via a merger with a SPAC.

And the market capitalization of these cryptos reached $3 trillion, trillion with a T, about a year ago, and then when the Fed started raising its interest rates and started doing QT, the whole thing just blows up. Companies go like POOF, and the money is gone, and whatever is left is stuck in bankruptcy courts globally possibly for years. Cryptos themselves have imploded. Many have gone to essentially zero and have been abandoned for dead. The granddaddy, bitcoin, has plunged by something like 73% from the peak. The whole crypto market is also down about 73%.

Crypto was one of the places where liquidity from money printing went to, and now that the liquidity is being drained ever so slowly, the whole space started to collapse.

Another thing that came about during the era of money printing was an immense stock market mania, and when the money printing went hog-wild starting in March 2020, the stock market mania went hog wild with it.

We at Wolf Street tracked a bunch of these stocks, crazy IPO stocks, and stocks that went public via a merger with a SPAC over the past few years, and they shot higher and they spiked on a wing and a prayer with nothing there, companies that were losing tons of money, that didn’t have a business model, that didn’t have anything, and they were suddenly worth $10 billion or $30 billion or whatever.

It was all driven by what I call consensual hallucination and the effects of money printing and interest rate repression. Those were the fundamentals.

But then in February 2021, when inflation started to heat up, causing the Fed to brush it off, well that February 2021 was when that craziness peaked, and many of these stocks then collapsed by 70% or 80% and over 90%. We tracked over 1,000 stocks traded in the US that have imploded by 80% or more from their highs within the past couple of years…..

*****

Continue reading this article at Wolf Street.

Why Are So Many Men Leaving the Workforce? thumbnail

Why Are So Many Men Leaving the Workforce?

By Ryan McMaken

Last week, CNN featured a story called “Men are dropping out of the workforce. Here’s why” The article went on to tell us virtually nothing at all about why so many men are leaving the workforce. Although as many as seven million men have stayed out of the workforce for varying reasons, the CNN piece was really about how more women are joining the workforce, and how wonderful it is that more women are working in “male dominated” fields. The fact that more women are joining the workforce, however, tells us nothing about why men are leaving. Indeed, the CNN piece offered only one reason to answer why men are leaving the workforce: they’re becoming stay-at-home dads.

That category, however, is fairly small and numbers only in the hundreds of thousands. That leaves us wondering why millions of men have left the workforce for reasons other than raising children. If we look deeper into the available information on the question, the reality appears to be a lot less rosy than CNN’s suggested reason of “their wives are so doggone successful, these men decided to stay home and raise the kids.”

Instead, the reasons driving the lion’s share of missing men to leave the workforce appear to be illness, drug addiction, a perceived lack of well-paying jobs, government welfare, and the decline of marriage. None of these are reasons to celebrate, and few of these reasons lend themselves to any quick fixes through changes in law or policy.

At Least Six Million Missing Men

As I noted earlier this month, there are at least six million men of “prime age” (age 25-54) who are out of the workforce for various reasons. Historically, this number has been getting larger at a rate faster than growth of total men in that age group. That is, fewer than 3 percent of prime-age men were “not in the workforce” in the late 1970s, but 5.6 percent of men in this group were out of the labor force in 2022. That translates into approximately 7.1 million men according to the Census Bureau’s count of men “not in labor force.”

We could contrast this with the proportion of women who are not in the labor force. Fewer prime-age women today are out of the labor force than was the case in the late 1970s. Women tend to remain out of the labor force in much larger numbers of men, so we find that in 2022, the total number of women out of the labor force is approximately 15 million. That number is smaller than what was common in the late 1970’s, however. As more women have joined the labor force over the past 40 years, more men have left.

Again, it is important to emphasize we are talking about prime age men here, and we’re excluding older and younger populations in which retirement and schooling remove large numbers of workers from the workforce.

Even including only prime age men, however, Alan B. Kreuger notes that the workforce trend in the US is headed downward faster than other wealthy countries:

Although the labor force participation rate of prime age men has trended down in the United States and other economically advanced countries for many decades, by international standards the labor force participation rate of prime age men in the United States is notably low.

Why Men Leave the Labor Force

Determining reasons for leaving the labor force is not easy, as the data depends heavily on surveys and on extrapolation. According to the census bureau, however, number less than 250,000 men in recent years are outside the labor force in order to care for children full time. This is only a tiny fraction of the total number of parents who leave the labor force to be stay-at-home parents. That leaves more than six million men who have left the labor force for some other reason.

Wages and Social Status

One thing is fairly clear: labor force participation is worse for men with less schooling. As Kreuger notes, labor force participation for prime age men has fallen for men at all education levels, “but by substantially more for those with a high school degree or less.” Indeed, labor force participation has barely fallen for men with advanced degrees, but has gone into steep decline among high school dropouts and those with no college.

Closely connected to this is the relative wage growth among these groups. While inflation-adjusted wages have increased significantly for men with college-level schooling or more, the same is certainly not true for men with “some college” or less. In these latter groups, earnings have stagnated since 1965, having risen throughout the mid 1970s, falling below the 1965 wage by 1995, and then slowly returning to 1960s levels. While this does not represent a sizable fall in wages in real terms since 1965, it is a large drop relative to the wages of men with more schooling.

(Women, incidentally, have not seen nearly as large declines in wages based on levels of schooling.)

This growing earnings gap between men at various education levels has been blamed for driving the exit of so many men from the workforce. For example, in a report from the Boston Federal Reserve earlier this month, research Pinghui Wu concludes that relative decline in wages drives more men to leave the workforce than has the overall decline in real wages. Moreover, Wu ties the decline in relative wages to declines in “a worker’s social status.” This effect is seen most strongly in non-Hispanic white men and younger men. Wu writes: “non-college-educated men are more likely to leave the labor force when the top earners in a state make disproportionately more than the other workers.”

Falling social status has been tied to low job-satisfaction, disability, and higher mortality. All of this tends to lead to lower workforce participation. Moreover, men at lower education and lower wage levels tend to be more prone to workplace injury, given the nature of the work. Indeed, as Ariel Binder and John Bound have shown, men who have exited the labor force say they are frequently in pain, and take pain medication regularly. Men in this group who are over 45 years of age also tend to be more frequently eligible for government disability benefits. Binder and Bound suggest that the expansion of disability benefits in recent decades “could explain up to 25 percent of the rise in nonparticipation among 45–54 year-old high school graduates (without college).”

The Decline of Marriage

Wu, Binder, and Bound all also point to another important factor in falling male workforce participation: changes in marriage patterns.

Wu notes that men with lower social status fare more poorly in the marriage market, and that “marriage market sorting [a] potential channels through which relative earnings affect men’s labor force exit decisions.” This would also help explain why declining social status also appears to especially affect younger men who are more likely to be active in pursuing a spouse.

Binder and Bound meanwhile note declining marriage rates are closely tied to workforce participation overall. This works in both directions: Declining incomes lead to declines in marriage. But unmarried men also have less incentive to actively seek employment. Marriage also may hamper a man’s ability to draw income from existing relatives. Binder and Bound write:

As others have documented, family structure in the United States has changed dramatically since the 1960s, featuring a tremendous decline in the share of less educated men forming and maintaining stable marriages. We additionally show an increase in the share of less-educated men living with their parents or other relatives. Providing for a new family plausibly provides a man with incentives to engage in labor market activity: conversely, a reduction in the prospects of forming and maintaining a stable family removes an important labor supply incentive. At the same time, the possibility of drawing income support from existing relatives creates a feasible labor-force exit.

It’s not just men with lower levels of schooling who marry less often, however. Marriage has indeed declined more for lower-income men than higher-income men. Declining marriage rates at the middle-class level and below, however, likely drive falling labor participation independent of wages. That is, “changing family structure shifts male labor supply incentives independently of labor market conditions” as unmarried men are simply less motivated to work.”

What Is to Blame?

The importance of relative wages points to the importance of economic factors in the decline of working men.

Enormous growth in government intervention in the twentieth century has led to a reversal of nineteenth century trends and led instead to capital consumption. It is notable that since the 1970s, savings and investment have declined, and Mihai Macovai notes ” the real stock of capital per worker has grown in a clear and sustained manner only until the end-1970s and fell afterwards until the trough of the Great Recession.” This has led to declining worker productivity and lower wages for many workers.

In more recent years, covid lockdowns impacted lower-income workers the most, and lockdowns are likely to raise overall mortality among these workers, as well, even years after the lockdowns ended. Unemployment and intermittent employment is tied to higher mortality rates and disability in both the medium and long terms.

Finally, a powerful factor is the central bank’s monetary policy which has been linked to a rising gap between higher-income workers and lower-income ones. Easy-money policy has been especially damaging to wealth-building for lower-income groups, as Karen Petrou notes in her book Engine of Inequality:

Ultra-low [interest] rates fundamentally eviscerated the ability of all but the wealthy to gain an economic toehold; instead they lead investors to drive up equity and other asset prices to achieve their return … but average Americans hold little, if any, stock or investment instruments. Instead, they save what they can in bank accounts. The rates on these have been so low for so long that these thrifty, prudent households have in fact set themselves back with each dollar they save. Pension funds are just as hard-hit meaning not only that average Americans can’t save for the future, but also that the instruments on which they count for additional security are unlikely to meet their needs.

But not all can be blamed on economic policy. The importance of marriage as a factor in workforce participation illustrates that some aspects of declining workforce participation lie beyond mere economics. Marriage rates for the middle class have continued to fall even in periods when median wages have increased—such as the 1990s. These trends are tied to changes in ideology, religious observance, and a host of social factors. Other factors such as rising drug addiction and obesity affect workforce participation as they are tied to disability and poor health, often at elevated rates among lower-income workers.

In other words, government policy certainly plays a sizable role in declining male workforce participation, but changing American culture cannot be ignored.

*****

This article was published by Mises Institute and is reproduced with permission.

Arizona Income Tax Flattens to 2.5% in January thumbnail

Arizona Income Tax Flattens to 2.5% in January

By Cameron Arcand

Arizona’s income tax will switch to a flat rate of 2.5% on Jan. 1, which will be the lowest in the nation among states that assess a state income tax.

Although it was initially expected to be implemented in 2024, Republican Gov. Doug Ducey announced in September that it would be bumped to the 2023 tax year.

“It’s time to deliver lasting tax relief to Arizona families and small businesses so they can keep more of their hard-earned money,” Gov. Doug Ducey wrote in a letter to Department of Revenue Director Robert Woods at the time.

Currently, the state has two income tax rates of 2.55% and 2.98% for 2022, and it used to be upwards of 4.5% in previous years.

This comes amid the state’s rapid economic and population growth, as well as high inflation nationwide. Many new residents and businesses have moved from other states, such as neighboring California.

The American Legislative Exchange Council’s “Rich States Poor States” report for 2022 ranked Arizona third for the economic outlook and first in performance.

“It’s no secret that Arizona’s economy is booming,” the governor said in the letter.

Meanwhile, the Phoenix Metropolitan Area currently has the highest inflation in the county at 12.1% as of October, according to the United States Bureau of Labor Statistics.

*****

This article was published by The Center Square – Arizona and is reproduced with permission.

The Second Housing Bubble of the Twenty-First Century Is Over thumbnail

The Second Housing Bubble of the Twenty-First Century Is Over

By Alex J. Pollock

The 21st century, only 23 years old, has already had two giant, international housing bubbles. It makes one doubt that we are getting any smarter with experience.

Among the countries involved in the second bubble, both the U.S. and Canada fully participated in the newest rampant inflation of house prices. Prices this time reached levels far above those of the last boom peak. In the U.S., the S&P/Case-Shiller National House Price Index by mid-2022 had risen to 67% over its 2006 bubble peak (130% over its 2012 trough). In Canada, the Teranet-National Bank House Price Index had soared to 143% over its 2008 peak (168% over its 2009 trough). What the Federal Reserve and the Bank of Canada both wrought with their hyper-low interest rate policies, were house prices which would be unaffordable as soon as mortgage interest rates returned to more normal levels. For a number of years, one could ask: When would that ever happen? Now we know: in 2022.

Now, in late 2022, with mortgage interest rates higher, housing bubbles are deflating, and house prices are dropping on a nationwide basis in both the U.S. and Canada. Here we go again into another house price fizzle following another house price boom.

How is it that we could find ourselves caught up in the problems of another housing bubble so soon? It is only ten years since 2012, the year house prices stopped falling in the U.S., and formed the trough of the painful bust which had followed the preceding bubble of 1999- 2006. Up to the point when house prices started falling across the U.S. last time, expert voices pronounced that U.S. house prices could fall on a regional basis, as they had numerous times, but that it was not possible for house prices to fall on a national basis in an economy so large and diversified. That theory could not have been more mistaken, and national average house prices fell 27%. In 2022, the theory is again being shown to be wrong, but how big the fall will be this time is not known or knowable.

We can take as a key ironic lesson that when large numbers of people believe house prices cannot fall, especially when they are emboldened by central bank behavior, it makes it more probable, and finally makes it certain, that the prices will ultimately fall. When they do, what had been built into everybody’s financial models as “HPA,” or “House Price Appreciation,” becomes instead “HPD”— “House Price Depreciation.” It would be better all along to refer to it as “HPC,” or “House Price Change,” thus reminding ourselves that prices of any asset can go both up and down, perhaps by a lot.

Ten years, it seems, is long enough to dim the memories that prices can move dramatically in both directions, even on a nationwide basis. A bubble market when extended for years makes a great many people happy, since they are making money and seem to be growing richer, and the higher their leverage, the faster they seem to be growing richer. As the great financial observer Walter Bagehot wrote 150 years ago, “the times of too high price” mean “almost everything will be believed for a little while.”

Then the reversal comes and different beliefs come to prevail. In just four months, from June to October 2022, U.S. median house prices dropped a remarkable 8.4%, with prices declining from their peak in all 60 of the largest metropolitan areas in the country. In October, sales of existing houses declined for the ninth month in a row, and were down 28% from a year earlier. Applications for a mortgage to buy a house were down 42% from the year before. Mortgage banks reported they were on average losing money on mortgage originations and many were laying off staff. The share price of 2021’s largest mortgage bank, Rocket Companies, was down 70% from its 2021 high. The CEO of the National Association of Home Builders stated, “We’re heading into a housing recession.”

In Canada, average house prices fell 7.7% from May to October, the largest five-month drop in the history of the Teranet index, which goes back to 1997. In Toronto, the country’s financial capital and a former star of rapid house price inflation, the May to October house price drop was a vertiginous 11.9%. Successive headlines in monthly Teranet-National Bank House Price Index announcements read: “Record price drop in August”; “Another record monthly decline in September”; “Another monthly decline in October.”

In spite of these rapid percentage rates of decline, house prices in both countries are still at very high levels. How much further can they fall from here? For the U.S., the Federal Reserve carefully stated in its latest Financial Stability Report, “With valuations at high levels, house prices could be particularly sensitive to shocks.” Coming to specifics, the AEI Housing Center predicts a 10%-15% national average fall in house prices during 2023. That would wipe out a lot of housing wealth that the bubble made people think they had, a reduction of perhaps $4 or $5 trillion of perceived wealth on top of the $3 trillion lost so far this year. It would put many houses bought near the top of the market, especially under government low- down payment programs, into no or negative owner’s equity.

For Canada, the Wall Street Journal suggested that its housing market is “particularly sensitive to monetary tightening,” and reported that Oxford Analytics “estimates that home prices in Canada could fall 30%.”

Recall that a price has no substantive reality: it is an intersection of human expectations, actions, hopes and fears. I like to ask audiences, “How much can the price of an asset change?” My proposed answer: “More than you think.”

Of course, nobody, including the Federal Reserve and the Bank of Canada, knows just where house prices will go, but we can all guess. Noted economist Gary Shilling wrote in November, “Price declines are just starting,” and “recent weakness probably has far to go.” This seems to me likely.

In any case, the second great housing bubble of this still young century is over and a new phase has begun.

*****

This article was published by The Mises Institute and is reproduced with permission.

Bidenomics: Nasdaq: -33%; S&P: -20%; Dow: -9%; Bonds: -12% thumbnail

Bidenomics: Nasdaq: -33%; S&P: -20%; Dow: -9%; Bonds: -12%

By Dr. Rich Swier

“Americans have lost $13.5 trillion in household wealth.” — Julio Gonzalez, @TaxReformExpert


As we approach January 1st, 2023 Americans have now had nearly two years of Biden’s Build Back Better agenda.

As a tweet by Carlos Löwenbraü put it, “If U hate Trump after this 24 month shitshow your commitment to stupidity is impressive.”

We must agree.

We have labeled those who elected Biden “the depraved electorate.” The depraved are the 87% of Democrats who give Biden and his administration, “positive marks for the job he is doing.” The “depraved electorate” are willfully ignorant of what is really happening around them.

Our enemies are all taking advantage of this American fool while they can.

It will be far easier to limit and undo the follies of a Biden presidency that to restore the necessary common sense and good judgement of this depraved electorate willing to have such a man for their leader.

The problem is much deeper and far more serious than Mr. Biden, who is a mere symptom of what ails America. Blaming the prince of fools should not blind anyone to the vast confederacy of fools that made him their prince.

The republic can survive a Biden, who is after all, merely a fool.

It is less likely to survive a multitude of fools, such as those who made and now defend him as their president!

Time to focus on the depraved electorate who defend, encourage and support Biden, the prince of fools.

Will November 2024 be a reckoning? Will the electorate give us a conservative president and majorities in both the U.S. House and Senate?

If not gird your loins. Armageddon is coming!

©Dr. Rich Swier. All rights reserved.

Under The Biden Economy, The Average Family Lost $7,100 thumbnail

Under The Biden Economy, The Average Family Lost $7,100

By Isabelle Morales

President Biden’s policies have now cost the average American family about $7,100according to a new report by the Heritage Foundation. While Democrats have proven time and time again that they value their social agenda more than Americans’ economic security, the level of harm represented in this figure is shocking… and infuriating.

As the Heritage report outlines, the average family has lost $5,800 due to inflation and $1,300 due to higher interest rates:


Under Biden, prices have risen so much faster than wages that the average family has lost $5,800 in real annual income. That loss is thanks to the ‘hidden’ tax of inflation, caused by the Biden administration and congressional Democrats’ policies.

Higher interest rates are now costing the typical family another $1,300 annually. Combined with a lower real income, this effectively costs families a total of $7,100 in annual income under Biden.

In January 2021, before Joe Biden took over the presidency, annual inflation was at a stable 1.4%. Since then, the high inflation rate has broken numerous 40-year records, has significantly outpaced wage growth, and has driven Americans to take on more debt than ever.

Today, over a year since inflation began surging, the consumer price index is still at an alarming rate of 7.1%. The price of food has increased by 10.6% over the year: staples like rice and poultry have increased by 14.1% and 13.1%, respectively. Energy prices have risen by 13.1%, with the cost of fuel oil increasing by an astounding 65.7% and energy services by 14.2%.

Wages are also falling behind. In November, the real average weekly earnings decreased by 3%. This trend has also been consistent for over a year.

At this point, a significant majority of Americans—63%—are living paycheck to paycheck. In fact, many are losing money each month and taking on debt to pay for essentials. The total credit card debt in the United States is now at $930 billion after a 15% jump in balances—the largest annual jump in more than 20 years. Not only are Americans taking on more debt, but they’re carrying these balances for long periods of time, making it even harder to pay off as interest piles. Among Americans who carry credit card debt from month to month, 60% have been in debt for over a year.

Because most credit cards have a variable rate, millions of Americans are directly and negatively affected by the Biden administration’s interest rate hikes.

On top of the Biden administration’s monetary policies, Americans have primarily been harmed by the Administration’s fiscal policies that have driven inflation.

President Biden has passed bills and executive orders that paid Americans not to workexpanded tax creditspaused federal student loan repaymentscanceled the Keystone Pipeline, and more.

Just a few months ago, during this time of high inflation and a recession, Democrats passed a massive tax-and-spend plan. Democrats’ reconciliation bill contained substantial tax hikes including a 15% corporate alternative minimum tax, a $6.5 billion natural gas tax, a $12 billion crude oil tax, a $1.2 billion coal tax, and several more. The reconciliation bill also included careless spending on climate initiatives, Obamacare subsidies, and supersizing the IRS.

Both tax hikes and reckless spending have driven inflation. According to a 2020 National Bureau of Economic Research paper, 31% of the corporate tax rate is borne by consumers through higher prices of goods and services. Further, the federal government has flooded the economy with so much money that demand is growing too fast for production to keep up, also resulting in inflation.

A $7,100 donation to one family, in many circumstances, could be life-changing. The theft of $7,100 over the course of the year is equally life-altering, though Democrats had hoped it would simply go unnoticed. They should not get away with it. For ineffective climate subsidies and COVID funds that disappeared before our very eyes, the Left has stolen thousands of dollars from working families.

*****

This article was published by Independent Women’s Forum and is reproduced with permission.